“Men become feminine”: why the birth rate has fallen in Russia
Demography: Russia Fails “Women's Issue”»
The Federal State Statistics Service of Russia published the Demographic Forecast until 2035. According to the forecast of Rosstat, the population of Russia by 2036 will remain at the level of 2017 - 147 million people, plus or minus a few percent. At the same time, the share of the able-bodied population will remain almost constant - 55–56%. Such data are not enough for the number of working ages see internal changes. Indeed, if within these 55–56% there will be an increase in the number of young people up to the age of 40 years, and a decrease in the number of the older part of working age, then Russia’s favorable demographic future lies ahead. And something completely different awaits us if, on the contrary, the young part decreases.
Developing the forecast of Rosstat, (by which method - more on that below), we can determine the dynamics of the number of young ages until 2040.

Separating men and women on the graphs does not make much sense, since the downturns and ups in the dynamics of the future number of 20-year-olds, 30-year-olds and 40-year-olds are almost twofold. And the number of men and women aged 20 to 40 years differs only by a few percent.
What makes this chart understandable?
The first one. The number of 20-year-olds will increase until 2035, but only slightly.
The second one.The number of 30-year-olds will begin to decline in the coming years. Moreover, in the first half of the 2020s, the reduction will be very strong - about 10% annually.
The third. The number of 40-year-olds will increase until the second half of the 2020s. But this increase will be negligible. And in the 2030s, the reduction will begin, at about the same rate as the reduction of the 30-year-olds in 2020.
So the total number of young people of working age in the interval 2018−2040 will decrease.

Finally
In recent years, official publications are full of peppy statements about the emerging long-term favorable trend in the demography of the Russian people.
In Russia, the Russian people make up about 80% of the total population. So the results of spectral analysis of the forecast of Rosstat can be extended to the Russian people.
I like it, I don’t like it, but there are no grounds for vigorous statements about the emerging long-term favorable trend in the demography of the Russian people.
Demography. The future of the country [Our country]
Why is Russia dying out? (Romanov Roman)
More detailed and a variety of information about the events taking place in Russia, Ukraine and other countries of our beautiful planet, you can get on Online Conferencesconstantly held on the site "Keys of knowledge." All Conferences - open and completely free. We invite everyone interested ...
In the Russian Federation, according to the Federal State Statistics Service, for three years starting from 2013 inclusive, a natural population growth was recorded annually. In 2015, the natural increase in the population of Russia for 1 year amounted to +32038 people. As of January 1, 2017, the population of the Russian Federation reached 146.84 million people.
The issue of a breakthrough in demography today is turning into the most important for the Russian Federation, and increasing, protecting and saving human capital are becoming the most priority areas of Russian state policy for the entire 21st century and a matter of national security.
Living in the largest country in the world by territory, Russians make up only 2% of the total population of the Earth. While the inhabitants of, for example, China account for 19%, India - 18%, and the United States - 4% of the total population of the planet.
To attract the attention of federal and regional authorities, as well as civil society as a whole, to the problem of maintaining high-quality human capital and a stable increase in the country's population, the Sober Russia Federal Project and the Expert and Analytical Center under the Public Chamber of the Russian Federation conducted a unique joint comparative study, the result of which was the first "National fertility rating in the subjects of the Russian Federation-2017".
“Fertility Rating-2017” was prepared in order to present to the public, state authorities and local authorities an objective picture of both the fertility rate and the level of “social comfort” for population growth in different regions of the Russian Federation.
The objective of the 2017 Birth Rate Rating is to stimulate federal and regional authorities to do better and more targeted work to strengthen and improve human capital, as well as to replicate positive regional experience in the framework of the federal state demographic policy.
The “fertility rating score” in a particular subject of the Russian Federation is the score that was assigned to the region based on the analysis of five criteria: “fertility”, “population growth”, “number of children per 1 woman”, “number of artificial terminations of pregnancy”, and "Level of social comfort for fertility."
The final score of the region determined the position of the subject of the Russian Federation in the "National birth rate ranking 2017". The higher the score, the better the region and the higher the place it occupies.
The ranking of the regions was carried out from the most prosperous (1st place) to the most problematic (85th place). The “fertility rating score” ranges from 24.33 to 41.95).
The “fertility rating score” is a kind of public index that the authors of the rating suggest using in the formation of regional strategies to strengthen demographics and increase the regional level of social comfort for fertility.
|
The subject of the Russian Federation |
||
|
Tyva Republic |
||
|
Chechen Republic |
||
|
The Republic of Ingushetia |
||
|
The Republic of Dagestan |
||
|
Nenets Autonomous Okrug |
||
|
Altai Republic |
||
|
Tyumen region |
||
|
The Republic of Buryatia |
Counting Procedure
The natural values \u200b\u200bof each indicator were converted into a standardized form - the “sten” scale with a value from 1 to 10. Moreover, the scales were inverted in such a way that, by any criterion, “1” means “very bad”, and “10” - “very good ". For example, in terms of "alcoholization", the higher the standardized score, the less liters of pure alcohol per person per year, and in the "number of square meters per person" indicator, the higher the standardized score, the more meters per person in the region.
The total score for individual factors of criterion No. 5 was calculated by summing the standardized scores for all indicators analyzed in a particular factor.
The values \u200b\u200baccording to four demographic criteria: “birth rate”, “population growth”, “number of children per 1 woman” and “artificial termination of pregnancy” were included in the final “birth rate rating score” with a weight of “1”.
And the total score according to the fifth social criterion - “the level of social comfort for fertility” - the experts proposed to include in the final “birth rate rating score” with a weight of “0.1”.
|
The subject of the Russian Federation |
||
|
The Republic of Sakha (Yakutia) |
||
|
Astrakhan region |
||
|
Republic of Kalmykia |
||
|
Republic of Bashkortostan |
||
|
Republic of Tatarstan |
||
|
Omsk region |
||
|
Udmurt republic |
||
|
st. Petersburg |
||
|
The Republic of Khakassia |
||
|
Transbaikal region |
||
|
Chuvash Republic |
||
|
Komi Republic |
||
|
Mari El Republic |
||
|
Perm region |
||
|
Krasnodar region |
||
|
Chukotka Autonomous Okrug |
||
|
Belgorod region |
||
|
Kamchatka Krai |
||
|
Sverdlovsk region |
||
|
Kaluga region |
||
|
sevastopol |
||
|
Irkutsk region |
||
|
Moscow region |
||
|
Republic of Adygea |
||
|
Krasnoyarsk region |
||
|
Chelyabinsk region |
||
|
Rostov region |
||
|
Kurgan region |
||
|
Samara Region |
||
|
Stavropol region |
||
|
Orenburg region |
||
|
Khabarovsk region |
||
|
Vologda Region |
||
|
moscow city |
||
|
Republic of Crimea |
||
|
Tomsk region |
||
|
Novosibirsk region |
Comments
LeaderThe Sober Russia Federal Project, member of the Public Chamber of the Russian Federation Sultan Khamzaev:“The importance of this rating lies in its vital need for the country. It is precisely today that the issue of growth of human capital and increase in the able-bodied part of the population is a cornerstone for Russia. Indeed, the "birth rate growth" is perhaps one of the most key vectors for the development of the country. Thanks to this rating, we would like to study and analyze the current and objective birth rate situation in each region of the Russian Federation.
In the Russian Federation there are regions in which many children give birth. Moreover, only in about half of the country's regions there is a natural population growth (43 regions). In this regard, we attempted to analyze which social factors in these “demographically prosperous” regions can be identified as positive social motivators of the birth rate. At the same time, there is the other half of the country (42 regions), these are the subjects of the Russian Federation where mortality exceeds birth rates, and there is a natural population decline. In such regions, we decided to isolate negative social indicators of fertility. Together, we conditionally designated these social factors as the regional level of “social comfort” for fertility. From our point of view, the first fertility rating of all subjects of the Russian Federation will help the regions to adjust their demographic policy and will become a kind of incentive for the exchange of positive practices. We want to make such a rating annual. ”
Head of the Expert Analytical Center at the Public Chamber of the Russian Federation Kirill Akimov: “National fertility rating in the constituent entities of the Russian Federation-2017” - created in 2017 for the first time. The 4 National Criteria were taken into account in the “National Birth Rate Rating for the Subjects of the Russian Federation-2017”, such as “Fertility”, “Population growth / decline”, “Number of children per 1 woman”, “Artificial abortion”, as well as a new complex compound proposed by experts the criterion is “the level of social comfort for fertility” in each of the constituent entities of the Russian Federation. For its calculation, the experts identified 9 most socially significant factors, each of which was previously ranked according to 1-5 objective statistical indicators. As a result, of the total points for these five criteria, each region is assigned a regional “birth rate rating score”. We hope that the new “National fertility rating in the constituent entities of the Russian Federation-2017” will serve as an incentive to improve the state demographic policy. ”
|
The subject of the Russian Federation |
||
|
Altai region |
||
|
Sakhalin Oblast |
||
|
Primorsky Krai |
||
|
Murmansk region |
||
|
Kaliningrad region |
||
|
Kostroma region |
||
|
Ulyanovsk region |
||
|
Lipetsk region |
||
|
Kirov region |
||
|
Yaroslavskaya oblast |
||
|
Ryazan Oblast |
||
|
Amurskaya Oblast |
||
|
Republic of Karelia |
||
|
Jewish Autonomous Region |
||
|
Arhangelsk region |
||
|
Saratov region |
||
|
Nizhny Novgorod Region |
||
|
Voronezh region |
||
|
Vladimir region |
||
|
Ivanovo region |
||
|
Kursk region |
||
|
Kemerovo region |
||
|
Novgorod region |
||
|
Penza region |
||
|
Tver region |
||
|
Tambov Region |
||
|
Tula region |
||
|
The Republic of Mordovia |
||
|
Volgograd region |
||
|
Bryansk region |
||
|
Oryol Region |
||
|
Smolensk region |
||
|
Magadan Region |
||
|
Pskov region |
||
|
Leningrad region |
Criteria
The most important criteria for studying both natural fertility and those social factors that positively or negatively affect the degree of population growth or decline in each constituent entity of the Russian Federation were selected as the basis for the compilation of the “National fertility rating in the constituent entities of the Russian Federation-2017”.
In the “National fertility rating in the constituent entities of the Russian Federation-2017”, the following 5 criteria were used for each region: “Fertility”, “Population growth”, “Number of children per 1 woman”, “Artificial abortion” and “Level of social comfort for fertility” .
Criterion number 1. "Fertility"
The first criterion - “Fertility” is the basic and fundamental for the “Fertility Rating-2017”. This criterion fixes the number of children born per 1000 people. population in each subject of the Russian Federation.
The highest birth rates (places 1-10) were registered in the Republic of Tuva, the Chechen Republic, the Altai Republic, the Republic of Ingushetia, the Republic of Dagestan, the Nenets Autonomous District, the Republic of Buryatia, the Republic of Sakha (Yakutia), the Tyumen Region and the Khanty-Mansiysk Autonomous Okrug - Ugra.
The lowest birth rates (places 76-85) were recorded in the Tver, Voronezh, Ryazan, Pskov, Penza, Smolensk, Tula, Tambov regions, in the Republic of Mordovia and in the Leningrad region.
Criterion number 2. "Population growth"
The second criterion, “Population Growth,” is also the second most important for the “Fertility Rating 2017”. This criterion registers the coefficient of natural growth of residents in each region of Russia. This coefficient is calculated as the difference between the total fertility and mortality rates. That is, it shows how much fertility exceeds mortality in each subject of the Russian Federation for a year. If in the region the birth rate exceeds mortality, then the "population growth" will be positive there. But on the contrary, the population growth becomes negative and is called "population decline". The coefficient of natural population growth for each region is calculated per 1000 inhabitants per year and is measured in ppm.
In the analyzed period, natural population growth was observed in only 43 subjects of the Russian Federation (51%) out of 85.
The top ten in terms of natural population growth (places 1-10) included the Chechen Republic, the Republic of Ingushetia, the Republic of Tuva, the Republic of Dagestan, the Yamalo-Nenets Autonomous Okrug, the Khanty-Mansiysk Autonomous Okrug - Ugra, the Republic of Sakha (Yakutia), the Nenets Autonomous Okrug, Tyumen region and the Altai Republic.
In addition, natural population growth was also observed in the following regions of the country: the Republic of Buryatia, the Kabardino-Balkarian Republic, the Chukotka Autonomous Region, the Republic of North Ossetia-Alania, the Republic of Kalmykia, the Karachay-Cherkess Republic, the Republic of Tatarstan, the Trans-Baikal Territory, Astrakhan Oblast, and Tomsk Oblast , Moscow, St. Petersburg, Irkutsk Region, Krasnoyarsk Territory, Udmurt Republic, Kamchatka Territory, Stavropol Territory, Komi Republic, Republic of Khakassia, Republic of Bashkortostan, Novosibi Sky Region, the Omsk Region, Khabarovsk Territory, the Chuvash Republic, the Republic of Mari El, Krasnodar, Perm Region, Sakhalin Region, the Murmansk Region, the Sverdlovsk Region, the Orenburg Region, the Magadan Oblast and Chelyabinsk region (places 11-43).
However, in 42 out of 85 constituent entities of the Russian Federation (49%), natural growth was negative, since a natural population decline was recorded there. Moreover, the largest natural population decline was noted in the following regions: Ryazan region, Vladimir region, Leningrad region, Oryol region, Novgorod region, Smolensk region, Tambov region, Tver region, Tula region and Pskov region (places 76-85).
Criterion number 3. “Number of children per 1 woman”
The third criterion of the "Birth Rate Rating 2017" is called the "Number of children per 1 woman." This criterion is the most accurate indicator of the birth rate for each region, as it indicates the number of children in this region per woman of childbearing age. This indicator fixes how many women on average would give birth to children during the entire reproductive period (from 15 to 49 years), if the birth rate of the studied year were maintained at each age. The value of “the number of children per 1 woman” does not depend on the age composition of the population and characterizes the average birth rate in a given calendar period in the region. Such a regional coefficient is calculated as the sum of age-specific fertility rates for age groups in the range of 15–49 years and is measured in “units”.
3 children
In the Russian Federation, only in 4 regions out of 85 (5%) per 1 woman three children are born. The Republic of Tuva rose to first place. The second to fourth places are occupied by the Chechen Republic, the Altai Republic and the Nenets Autonomous Okrug. (Places 1-4).
2 children
Two children per 1 woman are born in the following 16 regions of the Russian Federation (19%): Republic of Buryatia, Republic of Sakha (Yakutia), Yamalo-Nenets Autonomous Okrug, Kurgan Region, Chukotka Autonomous Okrug, Khanty-Mansiysk Autonomous Okrug-Ugra, Tyumen Oblast, Transbaikal Territory, Jewish Autonomous Oblast, Republic of Dagestan, Sakhalin Oblast, Perm Territory, Orenburg Oblast, Irkutsk Oblast, Udmurt Republic, and Komi Republic. (Places 5-20).
1 child
One child is born per 1 woman in 65 constituent entities of the Russian Federation (76%).
Places 21-75 were distributed between the regions in the following order: Republic of Mari El, Republic of Khakassia, Republic of Ingushetia, Astrakhan Region, Sverdlovsk Region, Republic of Bashkortostan, Republic of North Ossetia-Alania, Vologda Region, Kirov Region, Omsk Region, Chuvash Republic, Kostroma Region Kamchatka Territory, Republic of Tatarstan, Khabarovsk Territory, Chelyabinsk Region, Krasnodar Territory, Amur Region, Krasnoyarsk Territory, Kaluga Region, Republic of Kalmykia, Sevastopol, Arkhangelsk Region, Republic of Crimea, Novosibirsk Region, Altai Territory, Novgorod Region, Republic of Karelia, Primorsky Territory, Kabardino-Balkarian Republic, Kaliningrad Region, Pskov Region, Vladimir Region, Kemerovo Region, Republic of Adygea, Kursk Region, Murmansk Region, Ulyanovsk Region, Samara Region, Lipetsk Region, Tver Region, Yaroslavl Region, Moscow Region, Nizhny Novgorod Region, Magadan Region, Bryansk Region, Stavropol Territory, Ryazan Region, Ivanovo Region, Rostovsk I am the region, Oryol region, Saratov region, Tomsk region, St. Petersburg and Volgograd region.
The ten most recent places by this criterion are occupied by the Tula region, Belgorod region, Penza region, Karachay-Cherkess Republic, Smolensk region, Voronezh region, Tambov region, Moscow, the Republic of Mordovia and the Leningrad region (Places 76-85).
Criterion No. 4. "Artificial abortion"
As the fourth criterion for the "Fertility Rating 2017", experts proposed to analyze the number of artificial abortions (abortions) in the regions. To do this, we studied such a statistical indicator as "The number of artificial abortions (abortions) per 100 births" in each subject of the Russian Federation.
This criterion is included in the list of the main criteria of the "Birth Rate Rating-2017" because, according to experts, it is a factor that affects the demographic situation of the regions.
It seems that preventive work, as well as improving measures to reduce the number of induced abortions (abortions) in the constituent entities of the Russian Federation, in the long term can affect the demographic situation of the country as a whole.
The lowest values \u200b\u200bof this indicator were registered in the Republic of Dagestan and in the Chechen Republic (12 abortions per 100 births), as well as in the Republic of Ingushetia (13 abortions per 100 births).
The maximum values \u200b\u200bof this indicator were recorded in the Magadan Region (97 abortions per 100 births), in the Jewish Autonomous Region (81 abortions per 100 births) and in the Pskov Region (74 abortions per 100 births).
Criterion number 5. “The level of social comfort for fertility”
Since the level of social comfort for fertility was difficult to imagine as a single ready-made statistical indicator, a new scheme was proposed for the analysis and calculation of criterion No. 5 in each of the regions of Russia.
In order to calculate the “Level of social comfort for fertility” in each of the constituent entities of the Russian Federation, experts identified 9 most socially significant factors: 1) “Alco / drug / tobacco” (level of alcohol, drug and tobacco threats); 2) "Housing and communal services" (housing, especially for young and large families); 3) "Healthy lifestyle"; 4) “Infrastructure of childhood” (number of children per 100 places in kindergartens); 5) “The standard of living of the population” (the ratio of salaries to the cost of living for children); 6) Force Majeure (infant mortality rate in the region); 7) “Sustainability of the family” (the number of marriages and divorces); 8) “Healthcare” (how many obstetric beds are provided); 9) “Number of children in a family” (the proportion of large families).
In total, 19 statistical indicators were selected for objectivity and breadth of coverage: from 1 to 5 series of data for each social factor.
As a result, all regions were first separately ranked for each of 9 social factors that positively or destructively affect fertility. Then, out of 9 total points, the total score was calculated according to criterion No. 5.
As a result, those regions where the most comfortable social environment for fertility was created in Russia received the maximum scores according to criterion No. 5: Belgorod Oblast, St. Petersburg, and Tambov Oblast. (Places 1-3).
The minimum points for this criterion No. 5 went to the regions: Moscow, the Irkutsk region and the Chechen Republic. (Place 83-85).
Socially comfortable fertility environment
The nature of the influence of various social factors on the ongoing demographic processes in the regions is heterogeneous. If the subject, for example, takes care that young and large families receive their own housing (the factor “housing and communal services”), as well as a “healthy lifestyle” of the population, then this creates a “comfortable social environment” for adding families and increasing birth rate. Such good practices of leading regions should be advertised and replicated.
On the contrary, in those regions where there is an increased “alcohol, tobacco or drug threat”, as well as where there is a high “infant mortality”, elements of an uncomfortable social environment are formed that destructively affect not only the birth rate in a particular region, but also lead to a decrease population in the country as a whole. For such regions, more effective innovative prevention strategies should be developed.
This criterion was introduced to attract the attention of scientists, specialists, civil society, as well as representatives of regional and federal authorities in creating the most comfortable social environment for fertility.
Indicators of the level of social comfort for fertility
When assessing the “level of social comfort for fertility” in the subject of the Russian Federation, experts suggested that for each of these 9 factors, 1 to 5 regional profile statistical indicators be examined.
Factor No. 1. "Alco / drug / tobacco":
Indicator 5.1.1.Alcoholization (sales of alcohol in liters of pure alcohol per person).
Indicator 5.1.2. The amount of money spent per capita in the region on the purchase of cigarettes in specialized retail stores (thousand rubles).
Indicator 5.1.3. The state of drug addiction (the number of patients registered in medical institutions per 100 thousand people with a diagnosis of drug addiction (people)).
According to the sum of the scores of three indicators of factor No. 1, the Republic of Ingushetia was in first place with minimum values, and Sakhalin Oblast was in 85th place (with maximum values).
Factor number 2. "Housing and communal services":
Indicator 5.2.1.The total area of \u200b\u200bresidential premises, falling on average per 1 resident (at the end of the period), (sq. Meter).
Indicator 5.2.2. Number of young families registered as needing housing.
Indicator 5.2.3. The number of young families registered as needing housing and improved housing conditions.
Indicator 5.2.4. The number of large families registered as needing housing.
Indicator 5.2.5. The number of large families that received housing and improved housing conditions.
According to the sum of the points of five indicators of factor No. 2, the first place is taken by St. Petersburg, and the 85th place is taken by the Chechen Republic.
Factor No. 3. “Healthy lifestyle”:
Indicator 5.3.1.The proportion of the population systematically involved in physical education and sports in the total population.
Indicator 5.3.2. The number of sports facilities per 100 thousand people (units).
Indicator 5.3.3. One-time throughput of sports facilities.
By the sum of the points of three indicators of factor No. 3, Belgorod Oblast is in first place, and the Republic of Ingushetia is in 85th place.
Factor 4. “Infrastructure of childhood”:
Indicator 5.4.1.The number of children per 100 places in preschool educational institutions.
According to this indicator of factor No. 3, the Chukotka Autonomous Okrug is in first place, and the Chechen Republic is in 85th place.
Factor No. 5. "The standard of living of the population":
Indicator 5.5.1.The average monthly nominal accrued wages of employees of organizations (rubles).
Indicator 5.5.2. The subsistence minimum per child under 16 years old, established in the constituent entities of the Russian Federation for the IV quarter of 2015 (rubles).
By the sum of the points of two indicators of factor No. 5, the first place was taken by the Tyumen region, and the 85th place - by the Pskov region.
Factor No. 6. Force Majeure:
Indicator 5.6.1.Infant mortality (number of children dying before the age of 1 year, per 1000 live births).
According to this indicator of factor No. 6, the Chuvash Republic (the minimum indicator) moved up to first place, and the Chukotka Autonomous Okrug (the maximum value) took 85th place.
Factor No. 7. “Sustainability of the family”:
Indicator 5.7.1.Marriage rate (per 1000 population).
Indicator 5.7.2.The number of divorces per 1000 marriages.
By the sum of the points of these two indicators of factor No. 7, Sevastopol was in first place, and Leningrad Oblast was in 85th place.
Factor 8. Healthcare:
Indicator 5.8.1. The number of obstetric beds and provision per 10,000 women of childbearing age (15-49 years).
As a result of the analysis of this indicator of factor No. 8, the first place is occupied by the Republic of Tuva, and the 85th place - by the city of Moscow.
Factor 9. “Number of children in a family”:
Indicator 5.9.1. The share of family cells (%) with 3 or more children in the Russian Federation (according to the 2010 All-Russian Population Census and the 2014 Population Census).
In the study of this indicator of factor No. 9, the Republic of Ingushetia was in first place, and St. Petersburg was in 85th place.
Study frequency
"National birth rate rating in the constituent entities of the Russian Federation - 2017" is the second joint study of the Sober Russia Federal Project and the Expert Analytical Center under the Public Chamber of the Russian Federation. In 2016, in a series of similar studies, the “National sobriety rating of the constituent entities of the Russian Federation - 2016” was presented.
In order to ensure the possibility of further monitoring the dynamics of “fertility” in the regions, it is proposed to continue the approach used in this study in the future.
The initiators of the study plan to make the "National fertility rating in the constituent entities of the Russian Federation" annual.
Forecast
Today, population growth as a guarantor of Russia's demographic security should become a matter of national importance for our country.
The increase in fertility should be considered as one of the main priorities for the development of Russia.
Not only federal and regional state policies as a whole, but also all programs, subprograms, and various macro- and micro projects of the country should be strategically aimed at increasing birth rates.
The birthrate vector is now vital not only for every region of Russia, every city and village, but also every Russian family.
The issues of demographic stability of the Russian Federation are acquiring extraordinary social significance and relevance right now. Especially due to the fact that experts predict a slowdown in population growth in Russia in the very near future.
So, according to experts of the Federal State Statistics Service, starting in 2016, the natural population growth will go to the “negative zone”, that is, the country will see a roll to the “natural decline” of the population .
In order to timely attract the attention of federal and regional authorities, civic activists and society to the problem of maintaining a stable increase in the population in Russia and to return to the track a steady increase in the birth rate in all regions of our country, the first "National birth rate rating in the constituent entities of the Russian Federation-2017" was created.
The 2017 Fertility Rating was developed by the Sober Russia Federal Project and the Expert and Analytical Center under the Civic Chamber of the Russian Federation as an innovative tool for public control over the effectiveness of federal and regional state policies in the field of demography and fertility.
1-5 places
The first places (1-5) in the "Birth Rate Rating 2017" were distributed between the following regions: Republic of Tuva (41.95 points), Chechen Republic (41.88), Republic of Ingushetia (37.30), Republic of Dagestan (36.86 ) and the Nenets Autonomous Okrug (36.09).
All these 5 regions received a high total score for the first 4 demographic criteria: “Fertility”, “Population growth”, “Number of children per 1 woman” and “Number of artificial terminations of pregnancy”.
It is worth noting that the Chechen Republic took the lead in terms of these main four demographic criteria, although by a small margin.
In the competition between the Chechen Republic and the Republic of Tuva, the decisive factor that allowed the Republic of Tuva to take the lead was criterion No. 5, “Social comfort for childbirth”.
According to the total score for this criterion No. 5, the Republic of Tyva got 17th place, and the Chechen Republic got 85th place, which indicates an insufficient level of social comfort for fertility in the Chechen Republic and allows us to conclude that it is necessary to take a set of measures aimed at it improvement.
The most strongest among the indicators of this social criterion for the Republic of Tuva is “Number of children in a family” (“the proportion of family cells with 3 or more children”), as well as “Health” (“the number of obstetric beds and provision for 10,000 women of childbearing age (15 -49 years old) ”).
The indicators of this factor, which served as the location of the Chechen Republic behind the Republic of Tuva, were: “Housing and Utilities” (“total area of \u200b\u200bdwellings per average inhabitant”, “number of young families registered as needing dwellings”, “number young families registered as needing housing and improved housing conditions "," the number of large families registered as needing housing "," the number of large families receiving housing and improving housing search conditions ”),“ Infrastructure of childhood ”(“ the number of children per 100 places in preschool educational institutions ”), and“ HLS ”(“ the proportion of the population systematically engaged in physical education and sports in the total population ”,“ the number of sports facilities per 100 thousand people (units) ”,“ one-time throughput of sports facilities ”).
At the same time, experts draw attention to the fact that the first 4 classical criteria “Fertility”, “Population growth”, “Number of children per 1 woman” and “Number of artificial abortions” are of paramount importance for ranking regions (“weight“ 1 ”), and social criterion No. 5 is optional (weight "0.1"). However, it was this social criterion that was crucial in the rating, given the almost equal positions of the two leaders according to the first four criteria.
In this regard, the total score for “Social comfort for fertility” allowed the Republic of Tuva to overtake the Chechen Republic and get the highest total score in the birth rate rating-2017.
81-85 places
The last places (81-85) in the "Birth Rate-2017" were distributed between the following regions: Oryol Oblast (26.46 points), Smolensk Oblast (26.42), Magadan Oblast (25.79), Pskov Oblast (25.45 ) and Leningrad Oblast (24.33).
All these 5 regions received the lowest possible total score for the first 4 demographic criteria: “Fertility”, “Population growth”, “Number of children per 1 woman” and “Number of artificial terminations of pregnancy”.
It is worth noting that the Leningrad region took the last place in terms of the total score for the main four demographic criteria, although with a not very large margin from the Pskov region.
In the competition between the Leningrad Region and the Pskov Region, the decisive factor, which left the Leningrad Region in the last position in the ranking, was the total score for criterion No. 5 “Social comfort for childbirth”.
According to the total score for this criterion No. 5, Leningrad Oblast got 81st place, and Pskov Oblast - 57th place, which indicates an insufficient level of social comfort for fertility in both regions and allows us to conclude that it is necessary to take a set of measures aimed at it improvement.
Among the indicators of this social criterion for the Leningrad Oblast, the most significant aspects were “housing and communal services” (“total area of \u200b\u200bdwellings per average inhabitant”, “number of young families registered as needing dwellings”, “number of young families registered as those in need of housing and improved housing conditions "," the number of large families registered as needing of housing "," the number of large families who received housing and improved housing search conditions ”),“ Infrastructure of childhood ”(“ the number of children per 100 places in preschool educational institutions ”) and“ Living standards ”(“ average monthly nominal accrued wages of employees of organizations ”and“ the cost of living for a child under 16 years old ”) )
The above advantages and disadvantages of all five regions that complete the ranking lines can serve as an incentive for them to study the best regional practices and take measures to strengthen human capital in these constituent entities of the Russian Federation.
st. Petersburg and Moscow (places 21 and 48)
Both regions received a low overall score for the first 4 demographic criteria: “Fertility”, “Population growth”, “Number of children per 1 woman” and “Number of artificial terminations of pregnancy”.
It is worth noting that St. Petersburg in terms of points for these demographic indicators overtook Moscow by 11 positions.
In the competition between St. Petersburg and Moscow, the decisive factor that allowed St. Petersburg to increase the gap and improve its position by 6 points was the criterion No. 5 “Social comfort for childbirth”.
According to the total score for this social criterion No. 5, St. Petersburg received the 2nd place, and Moscow the 83rd place, which indicates an insufficient level of social comfort for the birth rate in the capital and allows us to conclude that it is necessary to take a set of measures aimed at improving it.
Among the indicators of this social criterion No. 5 for Moscow, the most strong side was “Living standard” (“average monthly nominal accrued wages of employees of organizations” and “subsistence minimum per child under 16 years of age”) and “Family stability” (“marriage rate” (per 1000 people) ”and“ the number of divorces per 1000 marriages ”).
The indicators of this factor, which served as the location of Moscow behind the city of St. Petersburg, were: “Housing and Public Utilities” (“the total area of \u200b\u200bliving quarters, on average per inhabitant”, “the number of young families registered as needing living quarters” , "The number of young families registered as needing housing and improved housing conditions", "the number of large families registered as needing housing", "the number of large families receiving housing and improving housing lovia ")," Alco / drug / tobacco "(" sales of alcohol in liters of pure alcohol per person "," the amount of money spent per capita in the region on the purchase of cigarettes in specialized retail stores "," the number of patients consisting of registration in medical institutions per 100 thousand people with a diagnosis of drug addiction ")," HLS "(" the proportion of the population systematically engaged in physical education and sports in the total population "," the number of sports facilities per 100 thousand people (units ) "," Is one temporary capacity of sports facilities ”) and“ Healthcare ”(“ the number of obstetric beds and provision for 10,000 women of childbearing age (15-49 years old ”).
In this regard, the total score for "Social comfort for fertility" allowed St. Petersburg to overtake Moscow and get the final score in the 2017 birth rate ranking 27 positions higher than the capital.
Considering the goals and objectives of this rating, the above advantages and disadvantages of these cities of federal significance can serve as an incentive for studying and replicating best practices and taking measures to strengthen human capital.
Summary table
|
The subject of the Russian Federation |
||
|
Tyva Republic |
||
|
Chechen Republic |
||
|
The Republic of Ingushetia |
||
|
The Republic of Dagestan |
||
|
Nenets Autonomous Okrug |
||
|
Altai Republic |
||
|
Yamal-Nenets Autonomous Okrug |
||
|
Tyumen region |
||
|
Khanty-Mansiysk Autonomous Okrug-Ugra |
||
|
The Republic of Buryatia |
||
|
The Republic of Sakha (Yakutia) |
||
|
Kabardino-Balkarian Republic |
||
|
Republic of North Ossetia-Alania |
||
|
Astrakhan region |
||
|
Republic of Kalmykia |
||
|
Republic of Bashkortostan |
||
|
Republic of Tatarstan |
||
|
Omsk region |
||
|
Udmurt republic |
||
|
st. Petersburg |
||
|
The Republic of Khakassia |
||
|
Transbaikal region |
||
|
Chuvash Republic |
||
|
Komi Republic |
||
|
Mari El Republic |
||
|
Perm region |
||
|
Krasnodar region |
||
|
Chukotka Autonomous Okrug |
||
|
Belgorod region |
||
|
Karachay-Cherkess Republic |
||
|
Kamchatka Krai |
||
|
Sverdlovsk region |
||
|
Kaluga region |
||
|
sevastopol |
||
|
Irkutsk region |
||
|
Moscow region |
||
|
Republic of Adygea |
||
|
Krasnoyarsk region |
||
|
Chelyabinsk region |
||
|
Rostov region |
||
|
Kurgan region |
||
|
Samara Region |
||
|
Stavropol region |
||
|
Orenburg region |
||
|
Khabarovsk region |
||
|
Vologda Region |
||
|
moscow city |
||
|
Republic of Crimea |
||
|
Tomsk region |
||
|
Novosibirsk region |
||
|
Altai region |
||
|
Sakhalin Oblast |
||
|
Primorsky Krai |
||
|
Murmansk region |
||
|
Kaliningrad region |
||
|
Kostroma region |
||
|
Ulyanovsk region |
||
|
Lipetsk region |
||
|
Kirov region |
||
|
Yaroslavskaya oblast |
||
|
Ryazan Oblast |
||
|
Amurskaya Oblast |
||
|
Republic of Karelia |
||
|
Jewish Autonomous Region |
||
|
Arhangelsk region |
||
|
Saratov region |
||
|
Nizhny Novgorod Region |
||
|
Voronezh region |
||
|
Vladimir region |
||
|
Ivanovo region |
||
|
Kursk region |
||
|
Kemerovo region |
||
|
Novgorod region |
||
|
Penza region |
||
|
Tver region |
||
|
Tambov Region |
||
|
Tula region |
||
|
The Republic of Mordovia |
||
|
Volgograd region |
||
|
Bryansk region |
||
|
Oryol Region |
||
|
Smolensk region |
||
|
Magadan Region |
||
|
Pskov region |
||
|
Leningrad region |
The population of the Earth has reached its critical level. Currently, 7.5 billion people live on our relatively small planet, and every second a new life appears. However, such a huge population is distributed unevenly on the planet. In some countries, the birth rate is much higher than in others. This is primarily affected by factors such as genetics and the environment. Take, for example, all the countries of the African continent: in these states a higher birth rate, therefore, more and more babies appear every year. At the same time, people living in Europe or North America, for example, are not carriers of genes responsible for the emergence of a large number of descendants, and, as a result, these territories are not so densely populated. Today we’ll talk about a dozen countries with the highest birth rates in the world. Needless to say, all of them (with the exception of one) are located in Africa. These data were obtained thanks to the latest census. Statistically, the birth rate is classified for thousands of people. According to these data, the following countries were in the top ten with the largest number of children who are born annually.
10. Afghanistan
The Islamic Republic of Afghanistan is located in southeast Asia. This densely populated state is estimated to have reached a birth rate of 38 people per 1000 population. Currently, 32 million people live in Afghanistan, but it is expected that their number will increase every year. The population is growing at a rate of 2.32% per year.
9. Angola
 Angola is the seventh largest state in Africa. According to the latest data, the population of Angola is 24.3 million people. It is one of the largest states in Africa with a significant birth rate, which is approximately 39 newborns per 1000 population. Given limited resources, such a rising birth rate could be a threat to the country's economy.
8. Somalia
 This African state is located in the Horn of Africa, and its population is more than 10.8 million people. The country was in eighth place due to the birth rate, which is 40 babies per 1000 population. Although the birth rate is quite high in this part of the region, Somalia has a higher birth rate than in most countries. Every year, the natural population growth increases by 3%. Somalia is the sixth largest country with the highest birth rate in the world.
7. Malawi
 This country on the African continent, like many others, boasts a high birth rate. According to the latest data, 17,377,468 people live in the country. The birth rate recently has been nearly 42 babies per thousand. Malawi is often called the "warm heart of Africa" \u200b\u200bbecause of its hospitable population. The country's population is completely dependent on agriculture, but, apparently, it is not developed enough to meet the growing demands of the population, which is constantly increasing.
6. Burundi
 It is the second largest and one of the most populous states in Africa. Burundi is not only rich in fertile soils and developing agriculture, but also has higher birth rates than most other countries. According to the latest data, more than 42 babies per thousand people are born here, which allowed the total population to reach 10.3 million. Due to lack of resources, the population in Burundi suffers from many diseases, especially AIDS, which is why the average population growth is comparatively lower, despite the higher birth rate.
5. Burkina Faso
 As you can see, this is another African country that is in the top ten with the highest birth rate. It is located in western Africa and occupies a significant territory. The country is surrounded by the six most important states of Africa and has a total population of 18.3 million. The birth rate here is slightly lower compared to Burundi: 41 children per 1000 population. However, there are enough natural resources to satisfy the needs of a growing population.
4. Zambia
 Zambia is not as densely populated as most African countries, but has high fertility rates compared to the area it covers. Zambia is 70th on the list of the most populous states in the world. Its population is 15.2 million. Statistics show that the annual growth rate is about 3.3%, and the birth rate is 42 people per 1000 population. Despite the high birth rate, the country can cope with the needs of the population, since it has a large area and, as a result, more resources.
3. Uganda
 Like many other countries in Africa, Uganda is a densely populated and fertile country. Given the very high growth rates, it is not surprising that this is the third largest country with the highest birth rate, not only in Africa but throughout the world. The total population of Uganda is 39,234,256 people, and the birth rate is about 44 children per thousand people. The standard of living is quite low, since the government is not able to satisfy the needs of the entire population.
2. Mali
 This country is located on the edge of the Sahara desert in western Africa. The Republic of Mali is one of the most densely populated areas of Africa. Thanks to a fertility rate of 45 babies per thousand people, Mali’s population has now reached 15 786 227 people. Most of it lives in the countryside. Thus, most people are not able to achieve high living standards.
1. Niger
This country is located on the banks of the Niger River and is named after her. It is located in western Africa and covers vast territories. The birth rate here is very high and reaches 46 people per 1000 population. High fertility rates and its coefficient are the main obstacles to achieving great economic success of the country, as they make it difficult to generate income in accordance with needs.
Expert of the Center, Kravchenko L.I.
Occupying first place in the world in terms of area, Russia is rapidly losing its position in the demographic field. If in 1991 it was on the 6th place in terms of the population of the Russian Federation, then in 2012 - 10th place, by 2050 Russia will take 14th place. The reduction in population with such a vast territory poses a threat primarily to the territorial integrity of the state. The situation is obvious: the country is experiencing a demographic crisis. But the question remains open: by what factors and reasons is it determined and does it affect the entire population or is it selective?
This study is devoted to the analysis of this problem.
The demographic problem in Russia has been discussed for a long time. Since the mid-90s, the country has seen a decline in population. In 2010, the process of population decline was halted. According to Rosstat, in 2012 the population of Russia increased for the first time and amounted to 143.3 million people in the first half of 2013. (Fig. 1).
Fig. 1. The population of Russia 1990-2013, in million hours
The increase in population with a continuing natural decline was ensured by the migration balance. In 2013, according to Rosstat, Russia for the first time overcame a natural population decline. However, the dynamics of changes in natural growth demonstrates the excess of fertility over mortality in only a few federal districts of Russia. The question remains open - at the expense of whom did this “demographic miracle” happen? Does it have ethnic and religious roots or is it due to material factors (economic well-being of the regions)?
Until 2009, the North Caucasus remained the only federal district with a positive birth balance. In 2012, the number of such federal districts increased to four: North Caucasian, Ural, Siberian and Far Eastern. The growth in the Far Eastern Federal District is due to the increase in growth in the Republic of Sakha (ethnic composition: Yakuts - 49%, Russians - 30%). In the Siberian Federal District, an increase of 44% was ensured by population growth in the republics of Buryatia, Tyva, Khakassia, Altai, by 56% due to regions with a share of the Russian population of 83-88%. In the Urals Federal District, the surplus was achieved mainly due to the Khanty-Mansiysk and Yamalo-Nenets Autonomous Districts (the share of the Russian population is 63.5% and 59.7%, respectively). (Fig. 2). INIn the first half of 2013, the dynamics continued.

Fig. 2. Dynamics of natural population growth by Federal Districts, per person (according to Rosstat)
In the next two years, natural population growth is expected in the Volga and Southern Federal Districts. At the moment, the surplus in the Volga Federal District is in five national republics (Tatarstan, Chuvashia, Mari El, Bashkortostan and Udmurtia), as well as in the Orenburg region (75% of Russians) and Perm Territory (83% of Russians). The Southern Federal District has a surplus in Kalmykia and the Astrakhan region (61% of Russians). The increase in the district will be achieved due to the excess of the birth rate over mortality in the Krasnodar Territory (approximately in 2013) and the Republic of Adygea (approximately in 2014).
The most demographically disadvantaged Central Federal District will not achieve positive dynamics no earlier than 2017. According to the data for the first half of 2013, a natural population decline has remained in all regions of the Central Region, while Moscow is leading in terms of the positive balance of the natural population movement.
Table 1. Forecast of natural population growth by federal districts
|
Cent- |
North- |
North Caucasus |
Volga |
Ural |
Siberian |
Far Eastern |
||
|
Year has reached |
forecast - 2017 |
forecast - 2015 |
forecast - 2014 |
always gain |
forecast - 2014 |
|||
|
Subjects who will ensure |
Moscow, Moscow region |
Republic |
Kalmykia and Astra |
6 res |
Tatarstan, Mari El, Bashkor |
Khanty |
Altai Republic, Buryatia, Tuva, Khakassia, Zabaye- |
Sakha (Yakutia) |
The current state of natural population growth is characterized by a steady increase in the birth rate and a slower decrease in mortality. This is most likely due to the transfer of increased birth rates a generation earlier (years of perestroika) in the USSR.
The birth rate increase coefficient, which shows how many times the birth rate has increased in the districts, indicates accelerated growth in the North Caucasus (1.7 times), the Ural and Central Federal Districts. (Fig. 3).

Fig. 3. The ratio of the birth rate and mortality rate of 2012 to the birth rate and mortality rate of 2000
In relation to the growth rate of mortality, their slowdown is observed in all districts except the North Caucasus.
In absolute terms, the birth rate in the North Caucasus Federal District is significantly lower than the birth rate in other districts. However, in terms of relative indicators (fertility and mortality per 1000 people), the North Caucasus region shows the best indicators - high fertility and low mortality. On average, the birth rate in this district is higher than the average Russian birth rate by 4.1 units. , mortality lower by 5 units. The most disadvantaged region in the field of demography is the Central District - in terms of fertility 1.5 times and mortality rates 1.7 times worse than the North Caucasus Federal District. (Fig. 4).

Fig. 4. Fertility and death rates per 1,000 people in federal districts
The ratio of fertility to mortality in this district exceeded 2, while in the Ural, Siberian, and Far Eastern regions only 1 has been achieved in recent years. Although each federal district has shown a dynamic increase in the gap between fertility and mortality, the highest rates are in the North Caucasus region. (Fig. 5).

Fig. 5. Birth rate to death rate by district
In recent years, a dozen leaders in terms of natural population growth have not changed. So, the growth in the Republic of Dagestan is ahead of this indicator in all federal districts with positive dynamics (except the North Caucasus), and the growth in the Tyumen region and the Chechen Republic in 2012 is ahead of the surplus in the Siberian and Far Eastern federal districts.
The largest population decline was noted in a number of regions of the Central Federal District. The absolute leader in this indicator is the Moscow region, while Moscow is among the top ten in terms of natural growth. St. Petersburg and the Leningrad region have the same dynamics.
Table 2. Leaders in population growth in 2012
Table 3. Leaders by population loss in 2012
Traditionally, population decline is observed in regions with a predominantly Russian population. This is the most important effect. Among the demographic leaders are national republics with a low share of the Russian population, as well as the Tyumen region and the city of Moscow, in which the increase was achieved due to immigration and a high standard of living of citizens.
Based on the hypothesis that the natural decline directly depends on the share of the Russian population, we consider the dynamics of the natural population movement in 20 regions with a share of the Russian population above 90% and 9 regions with a share of 1 to 31%.
Regions with the highest percentage of ethnic Russian people show a decreasing natural population decline, but the prospect of achieving an excess of fertility over mortality in the coming years is unattainable. (Fig. 6).

Fig. 6. The balance of natural growth in 20 constituent entities of the Russian Federation with a share of the Russian population over 90%, per person
At the same time, in 9 subjects with a share of the Russian population from 0.7% up to 31%, the birth rate is much higher than mortality, with the leaders of the Islamic republics of the North Caucasus. (Fig. 7).

Fig. 7.The balance of natural growth in 9 regions of the Russian Federation, per person
In 2020, 2025 and 2030, the so-called “baby boom” will only affect national republics. In the Chechen Republic, Ingushetia, Tuva, Dagestan, the Altai Republic, Yakutia and the Nenets Autonomous Okrug, a population explosion will be observed every year.
Table 4. Regions with the expected highest birth rates
|
Chechen Republic |
Chechen Republic |
Chechen Republic |
|
The Republic of Ingushetia |
The Republic of Ingushetia |
The Republic of Ingushetia |
|
Tyva Republic |
Tyva Republic |
Tyva Republic |
|
The Republic of Dagestan |
The Republic of Dagestan |
The Republic of Dagestan |
|
Altai Republic |
The Republic of Sakha (Yakutia) |
Altai Republic |
|
The Republic of Sakha (Yakutia) |
Altai Republic |
The Republic of Sakha (Yakutia) |
|
Nenets Autonomous Okrug |
Nenets Autonomous Okrug |
|
|
Nenets Autonomous Okrug |
The Republic of Buryatia |
|
|
Kabardino-Balkar Republic |
Republic of North Ossetia-Alania |
Chukotka Autonomous Okrug |
|
Republic of Kalmykia |
Republic of Kalmykia |
Karachay-Cherkess Republic |
The worst fertility indicators in these years will show the regions with the Russian population. In 2030, another Orthodox people - the Mordvinians will also be far from the baby boom. The top ten regions with the lowest birth rates in 2020-2030 include mainly the regions of the Central Federal District.
Table 5. Regions with expected lowest birth rates
|
moscow city |
moscow city |
st. Petersburg |
|
st. Petersburg |
st. Petersburg |
moscow city |
|
Moscow region |
Leningrad region |
Leningrad region |
|
Tula region |
Moscow region |
Tula region |
|
Murmansk region |
Tula region |
Smolensk region |
|
Leningrad region |
Smolensk region |
Voronezh region |
|
Yaroslavskaya oblast |
Yaroslavskaya oblast |
Moscow region |
|
Ivanovo region |
Murmansk region |
Ryazan Oblast |
|
Kamchatka Krai |
Vladimir region |
The Republic of Mordovia |
|
Magadan Region |
Ivanovo region |
Tambov Region |
Thus, the demographic crisis is mediated by ethnic selectivity. The decline in the Russian population continues and has already led to its decline by more than 8 million people since 1989. Since 2002, the number of ethnic groups practicing Islam has increased. The number of Uzbeks doubled, 1.6 times Tajiks due to migration flows. The number of the Russian Islamic population increased, while the large growth rates were demonstrated by the peoples living in the North Caucasian Federal District. Of the Orthodox peoples, the number of Armenians and Ossetians increased. There was a reduction in such Orthodox ethnic groups as Russians, Udmurts, Mordovians, Chuvashs, Mari. The population of Udmurtia since 2009 began to grow due to natural growth in the republics of Mari El and Chuvashia - since 2012, there has been a decline in Mordovia, the number of the Russian population continues to decline due to the natural population decline.
Table 6. Ethnic composition of Russia according to the census, in million people
|
1989 year |
2002 year |
2010 year |
|
|
Whole population |
147,02 |
145,16 |
142,8565 |
|
Russians |
119,87 |
115,87 |
111,0169 |
|
Tatars |
5,52 |
5,56 |
5,310649 |
|
Ukrainians |
4,36 |
2,94 |
1,927988 |
|
Bashkirs |
1,35 |
1,67 |
1,584554 |
|
Chuvashs |
1,77 |
1,64 |
1,435872 |
|
Chechens |
1,36 |
1,43136 |
|
|
Armenians |
0,53 |
1,13 |
1,182388 |
Based on the 2010 census, the share of the Russian population in the population of the subjects can be said to reduce the Russian population in 2012 by 88,000 people, while the population of other nationalities increased by 108,000 people.
The rapid decline in the share of the Russian population in national republics poses a threat to the national security of the country: the connecting role of the Russian people is lost, regions that do not identify with Russia appear, ties between nations are broken in the spatial field of Russian civilization. The demographic situation in the region is becoming an indicator of separatist sentiments. The most unstable in this regard are such regions as Dagestan, Ingushetia, Chechnya, with a share of the titular peoples of more than 90%, as well as the Republic of Tuva. In these republics, the lowest proportion of people who speak Russian is also observed. Potential hot spots may be those regions in which the share of titular peoples exceeds 50%, and due to natural growth, this share is increasing.
Table 7. Regions with the greatest potential threat of nationalist discord with the Russian people and separatism
|
Subject of the federation |
Share of the titular people |
Share of Russians |
Share of Russian speakers |
|
The Republic of Dagestan |
|||
|
The Republic of Ingushetia |
|||
|
Chechen Republic |
|||
|
Tyva Republic |
|||
|
Republic of Kabardino-Balkaria |
|||
|
Chuvash Republic |
|||
|
Republic of North Ossetia |
|||
|
Republic of Kalmykia |
|||
|
Republic of Tatarstan |
|||
|
Republic of Karachay-Cherkess |
We introduce for further analysis the concept of the coefficient of "demographic stability", allowing to conduct cluster analysis.
do  where
where
N (t ) - the number of people for the corresponding year (census years were selected), R / C - the ratio of the total fertility rate to the total mortality rate. The entered coefficient indicates population growth due to the current natural increase and the demographic result of a long previous increase.
The threshold value in the case of a harmonious combination of positive signs of demographic sustainability (previous growth and current growth) is 2. If the coefficient is less than two, then the conclusion follows that something is not in order. Either earlier or at the current moment. It is from this that the possibility of a semi-quantitative assessment of "sustainability" follows. The calculation takes into account those nations that do not have statehood outside of Russia (to exclude the error associated with migration flows). (Fig. 8).

Fig. 8. The coefficients of demographic stability of the peoples of Russia
This figure shows that there is also a confessional attribute, “responsible” for demographic success. The coefficient of demographic stability has a pronounced confessional character: for peoples professing Islam it is 3.85; for Buddhists and shamanists - 2.86, for Orthodox peoples - 1.83. The only Orthodox people with a coefficient above 2 are Ossetians. The peoples of the Islamic area, Buddhist and other beliefs are demographically resurrecting more actively. Orthodoxy for some reason so far combined with the worst indicators of demographic development. Probably, the worldview mission of Orthodoxy has not yet become an effective factor affecting the reproductive tradition. The worst indicators are among Mordovians and Russians, who have not yet reached the level of self-reproduction of the population.
Thus, the problem of the demographic crisis in Russia is mediated not only by ethnicity, but also by a mental factor, in particular, the role and significance of the worldview function of religion. The problem of the revival of Orthodoxy is most acute in the Russian people. Therefore, indeed, we can talk about ethno-and confessional selective demographic crisis.
In the work “State policy of Russia’s withdrawal from the demographic crisis” a four-factor model is given that explains the demographic situation in the country. It includes the material factor, the ideological and spiritual state of society, the civilizational identity of the Russian state and the role of public policy in the management of demographic processes.
Usually the excessively exaggerated value of the material factor actually only to some extent affects the outcome of the natural movement of the population. The emphasis of government demographic policy on maternal capital does not particularly affect demography and does not explain the observed positive phenomena. in the current birth rate increase. More important is the psychological state of the population. Thus, the default stress of 1998 led to an increase in population decline in 1999, and the 2009 crisis slowed down the process of reducing population loss.
Improving fertility rates depends on the number of those who have entered childbearing age. The correlation between those born and those who have entered childbearing age is greatest when the childbearing age is 30 years, and also 25 and 29 (the birth rate of one year was compared with the birth rate of the year equal to the difference between the compared year and childbearing age). This correlation coincides with actual data on the distribution of mothers born by age. (Fig. 9).


It follows that the current improvement in the birth rate in Russia is associated with a high increase in the birth rate in the 80s. This was a short-lived psychological effect of perestroika. In the future, the birth rate should slow down, as a new generation of people of childbearing age is the children of the 90s, when there was a sharp drop in the birth rate. If we take 25 years for the average child-bearing age, then starting in 2013, the growth rate will slow down, however, if the child-bearing age is 30 years, then over the next five years you can still expect a birth rate increase, but from 2017 it will begin to decline steadily. (Fig. 10).

The material factor does not explain anything at all regarding the successful natural movement in national regions where the standard of living is low. Figure 11 shows the slowdown in declining losses in 2010 as the consequences of the 2009 crisis for entities with the largest share of the Russian population. (Fig. 11).

Thus, the demographic problem is only to a small extent determined by the material factor; the ideological and spiritual state of society has a significant impact.
The manifestations of the decadent ideological and spiritual state of the Russian and other Orthodox peoples are as follows:
Value crisis;
Late marriage: a decrease in the number of marriages between the ages of 18-24 and growth in the range of 25-34 years (Fig. 12);

Divorces. The number of divorces per 1000 people in the regions with the largest population decline is 3.9–4.8; in the republics of the North Caucasus, 0.9 –3;
Youth sexualization;
Extramarital reproduction;
Family nuclearization;
The problem of single people;
Abortion Since 2000, there has been a downward trend in the number of abortions, which is largely due to the practice of widespread use of contraceptives. But Russia still has the highest abortion rate in Europe. In absolute terms, the number of abortions in 2012 amounted to 1.06 million (for comparison, in 2000 - 2.13 million hours);
Alcoholization, drug addiction, substance abuse;
Suicide
Gender gap and the specificity of family relations;
The confessional basis of demographic variation.
The government refuses to notice the fact that low fertility and high mortality in our country are associated primarily with the spiritual state of society. So inDecree of the President of the Russian Federation of October 9, 2007 N 1351 “On approval of the Concept of the demographic policy of the Russian Federation for the period until 2025” is written, that "the current demographic situation in the Russian Federation is largely due to the socio-economic processes that took place in the 20th century."
The main reasons for the low birth rates are called: “low cash income of many families, lack of normal living conditions, modern family structure (focus on small families, an increase in the number of single-parent families), hard physical work of a significant part of working women (about 15 percent), working conditions that do not meet sanitary and hygienic norms, low reproductive health, a high number of abortions (abortions). ” However, if you look at the statistics, you can see that it is in the national republics, especially the North Caucasus Federal District, that the population with the lowest incomes lives, whose birth rate is not affected by either the income level or the crisis of 2009.
A new problem, exacerbating the demographic crisis in the country, is the immigration challenge of national identity. Currently, stabilization of the population in Russia has been achieved due to the migration balance (in 2012, the number of remaining migrants amounted to 294,930 people).
The first years after the collapse of the USSR were characterized by two flows of migration: the Russian population from the former Soviet republics to Russia and the Russian population from Russia to Europe, the USA and Israel. At the first stage, the influx and outflow of highly qualified personnel took place (Fig. 13).

A marked decrease in the outflow of population by the end of the 1990s. In the 2000s, the outflow of skilled labor decreased, but there was an increase in labor immigrants from a number of CIS republics. The coincidence of the dynamics of migration inflows from the CIS republics (Ukraine, Moldova, Armenia, Azerbaijan, the republics of Central Asia) indicates their labor quality. The exception is migrants from Kazakhstan, who are most likely the Russian population or assimilated Kazakhs who moved to Russia not for labor, but for permanent residence. (Fig. 14).

In 2012, 91% of all migration growth was in the CIS countries, of which 50% - These are representatives of the republics professing Islam (Azerbaijan, Tajikistan, Turkmenistan, Kyrgyzstan, Uzbekistan), together with Kazakhstan - 63.5%. The influx on the one hand of low-skilled labor, on the other hand, an increase in representatives of other religious faiths raises the question of the immigration challenge of national identity.
In the Concept of Demographic Policy of the Russian Federation for the period up to 2025, one of the tasks in the field of demographic policy is “attracting migrants in accordance with the needs of demographic and socio-economic development, taking into account the need for their social adaptation and integration”. This means that the current migration situation in the country is a consequence of the implementation of a specific task, which clearly does not correspond to the national security of the country.
It is further stated in the concept that measures in the field of migration policy will be: assistance to the voluntary resettlement of compatriots living abroad; attracting qualified foreign specialists, attracting young people from foreign countries (primarily from the member states of the Commonwealth of Independent States, the Republic of Latvia, the Republic of Lithuania and the Republic of Estonia) for training and internships in the Russian Federation with possible benefits in obtaining Russian citizenship upon graduation, creation of conditions for the integration of immigrants in Russian society and the development of tolerance in relations between the local population and immigrants from other countries in order to prevent ethno-confessional conflicts. It was not possible to attract qualified foreign specialists, a small number of compatriots from abroad returned, but instead of the declared attraction of qualified labor, labor migrants went to the country, who were called upon to solve the demographic problem.
As a result, the migration policy tool was used to solve the demographic problem, which in turn led only to visible improvements in the demographic situation and created more serious problems associated with the immigration challenge of the Russian identity and the integration of the new ethnic community into the multinational Russian people.
Solving the problems of demographic policy through attracting migrants and raising the standard of living of the population is not effective, since it completely ignores the fact that the current demographic situation is caused by a spiritual crisis, especially of the Russian people. The crisis, which is already obvious, is ethnically selective, but this fact is hushed up or not noticed, in any case, an adequate state political reaction to it does not occur.
Table 8. The peoples of Russia. Ranking by population (from larger to smaller)

Note:
* Data on fertility, mortality, and natural increase are estimated or not available.
** Peoples of the Republic of Dagestan
Color designation (column peoples) on confessional grounds.
Table 8 presents data on the demographic status of the peoples of Russia with more than 100,000 people in 2010. Based on these data, the following conclusions can be drawn.
In general, such measures as the Chechens, Armenians, Avars, Ossetians, Dargins, Buryats, Yakuts, Kumyks, Ingush, Lezghins, Tuvans, Karachais, Kalmyks, Laks, Cossacks, Tabasarans, Uzbeks, Tajiks generally do not need additional measures to stimulate the birth rate Balkarians. Their number and share in the country's population has increased, the birth rate is above the national average, the mortality rate is below the national average, the number of births exceeds the number of deaths. These peoples preserved their spiritual identity, did not accept the destructive values \u200b\u200bof the consumer society and demonstrate a high potential for further demographic growth.
An effective state policy of stimulating the birth rate is carried out in relation to the Tatars, Bashkirs, Chuvashs, Udmurts, Kabardins and Komi. Although their number and share in the country's population has declined, peoples have been able to achieve natural growth, the potential for their further demographic recovery is high fertility and low mortality. These peoples demonstrate unity, national self-identification, which is largely due to the presence of their own state education in Russia. They also retained more traditional moral and spiritual values.
It is necessary to take additional measures to stimulate the birth rate for Russians, Mordovians and Adyghe. An analysis of the situation of the Russian people speaks of an electoral policy of reducing its number: it is the only people in Russia that do not have their own statehood - it is Russian statehood, the birth rate remains below the average for Russia, the mortality rates are higher than average, the number and proportion of the population continues to decline steadily. The borrowed values \u200b\u200bof the consumer society, which decompose the spiritual foundation of the Russian people, the lack of cohesion, uniting national ideas and feelings of pride in their country, lead to the loss of the original spiritual guidelines, which finds its physical expression in the natural decline of the Russian population and a reduction in its number.
But it is the Russian people that are the bond of all Russian peoples, Orthodoxy that spiritual base that can unite different faiths on the principle of peaceful coexistence and harmonious development. Awareness of the described threat and adequate public policy are required.World Population Prospects: The 2012 Revision //United Nations, Department of Economic and Social Affairs, Population Division, 2013
The peoples whose numbers as of 2002 exceeded 100,000 were listed and who did not have statehood outside the Russian Federation.
State policy of withdrawing Russia from the demographic crisis /Monograph. V.I. Yakunin, S.S. Sulakshin, V.E. Baghdasaryan et al. Edited by S.S. Sulakshina. 2nd ed. - M .: ZAO ≪Izdatelstvo ≪Ekonomika≫, Scientific Expert, 2007. - 888 p.
Fertility is of great importance for every country. If in the state this indicator is low, then a threat to the territorial integrity of the country is created. High fertility and low improve, guarantee the preservation of the nation. Birth statistics allow you to track the necessary indicators.
Fertility is also an indicator of the level of a country. In poor countries, where people get a small, usually high level, few children are born. In developed countries, where there are good living conditions, the population is not afraid to give birth to several babies.
The dynamics of the population in the Russian Federation
The table shows the birth rate statistics in Russia by years. It can be used to judge how the natural population growth has changed:
| Year | Number of children born | Total population |
| 1927 | 4 688 000 | 94 596 000 |
| 1939 | 4 329 000 | 108 785 000 |
| 1950 | 2 859 000 | 102 833 000 |
| 1960 | 2 782 353 | 119 906 000 |
| 1970 | 1 903 713 | 130 252 000 |
| 1980 | 2 202 779 | 138 483 00 |
| 1990 | 1 988 858 | 148 273 746 |
| 2000 | 1 266 800 | 146 303 611 |
| 2010 | 1 788 948 | 142 865 433 |
| 2015 | 1 940 579 | 146 544 710 |
| 2016 | 1 888 729 | 146 804 372 |
To find out what gender of children is born more, there are birth statistics for boys and girls. Consider the indicators for the city of Novopolotsk. In 2014, about five hundred female children and almost six hundred male children were born. The year 2015 was marked by the birth of 595 boys and 537 girls. In other settlements, the situation is approximately the same.
Fertility statistics for girls and boys says that more male infants are born.
- Chechen Republic.
- Ingushetia.
- Yamal-Nenets Autonomous Okrug.
The worst performance is:
- Tyumen region
- Pskov region
- Tula region
The total number continues to decline, despite the fact that mortality did not exceed the birth rate statistics in Russia in 2016. At the same time, the state has reached a higher level. Fertility statistics for 10 years show that Russia ranked 63rd in the world (data for 2016) in terms of natural population growth. The table shows the main reasons why the Russians were dying (the period from January to August 2016):
| Number of people (in thousands) | |
| 716,7 | |
| 198,2 | |
| 13,5 | |
| 5,7 | |
| 16,3 | |
| 7,2 | |
| Infection | 21,8 |
Fertility statistics for 2016 show that the population density in the Russian Federation is 8.6 people per 1 km². This is one of the lowest rates in the world. Huge territories are simply empty. Villages and small towns have become extinct over the past 20 years, and some areas have never been populated.
The situation in the world at the beginning of 2017
According to statistics, the birth rate in the world increased by almost 50 million people in the first quarter of 2017. Every day, several hundred thousand babies are born in the world. Ethis fact can be checked by the counter of the population of the earth in the mode.
2017 fertility and mortality in Russia
Russia has always been the largest territorial state in the world. However, the population here is inexorably declining. The country is experiencing a demographic crisis. According to fertility statistics in Russia at the beginning of 2017, fewer children were born compared to the previous year.
Population Growth in Belarus and Ukraine
Fertility statistics by years in Ukraine:
| Year | Number of children born | Total population |
| 2000 | no data | 48 663 600 |
| 2005 | 426 100 | 47 100 462 |
| 2010 | 497 700 | 45 782 592 |
| 2015 | 411 800 | 42 759 300 |
Below is a chart withbirth statistics in Ukraine, as well as mortality by year (over the past 25 years). It clearly shows in which years the population of the country grew, and in which years it decreased.
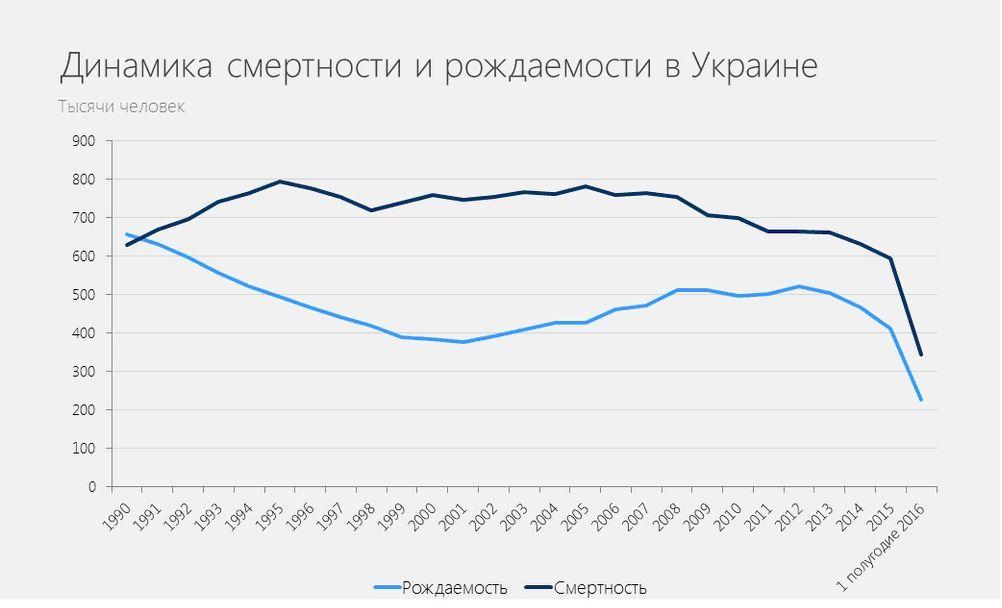 Fertility statistics in Belarus by years:
| Year | Number of children born | Total population |
| 2000 | 93 691 | 9 988 000 |
| 2005 | 90 508 | 9 664 000 |
| 2010 | 108 050 | 9 491 000 |
| 2015 | 119 509 | 9 481 000 |
Boy fertility statistics in the Republic of Belarus is given in numbers on the graph below. Male infants are born a little more than females. But recently, the number of boys born has declined slightly. As for the male and female population, judging by the table of men in Belarus there are more than women.
 In recent years, the population in the Russian Federation and Ukraine has decreased, but in Belarus has increased, the birth and death statistics in Russia confirm this fact.


Learning environment: new projects A typical project of a school with 825 seats
A catalog of typical projects of social infrastructure buildings has been created in the Moscow region
A catalog of typical projects of social infrastructure buildings has been created in the Moscow region
Turnkey Cottage Construction Roadmap
The report of the head of the Ministry of Construction of Russia Mikhail I at a meeting of the Commission under the President of the Russian Federation on monitoring the achievement of targets of socio-economic development of the Russian Federation