The intersection of the curves of the aggregate AD demand and the total proposal of AS gives the point of general economic equilibrium (N). The conditions of this equilibrium will be different depending on how the segment the curve of the aggregate supply AS intersects with the curve of the aggregate demand AD (Fig. 4.3).
Fig. 4.3. Equilibrium between cumulative demand and cumulative proposal
The intersection of the Curves AD and AS at point N reflects the equilibrium price of the equilibrium production volume.
If there is a violation of equilibrium, the market mechanism will equal the total demand and the total proposal; It will work primarily the price mechanism.
Two options are possible in this model:
1) The total supply exceeds the cumulative demand. In this case, the sale of goods is difficult, stocks increase, the growth of production is inhibited, it is possible to start a decline in production;
2) Cumulative demand overtakes an aggregate offer. Then the reverse situation comes: reserves are reduced, and unsatisfied demand stimulates production growth.
Economic equilibrium implies such a state of farm when all the country's economic resources are used. Equilibrium means that general structure Production is aligned with the structure of consumption. The equilibrium equilibrium is the equilibrium of supply and demand for all major markets. Changes in equilibrium occur with increasing (or decreased) of aggregate demand or total supply. Graphically changes in equilibrium are displayed by the displacement of cumulative demand (AD) curves (AD) or the Cumulative Proposition (AS).
Consider changes in equilibrium with an increase in the total demand on three segments of the curve of the cumulative supply.
The increase in the total demand on the horizontal (Keynesian) segment will lead to an increase in the level of employment and, accordingly, to an increase in the volume of the real national product.
The intersection of AS and AD curves on the short-term area (intermediate segment) means that the economy is in short equilibrium, in which the level of prices for final products and the real national product is established on the basis of the equality of total demand and the cumulative supply. Equilibrium in this case is achieved as a result of constant oscillations of supply and demand. An increase in total demand will entail as an increase in the actual volume of production and raising the price level. If the demand of AD exceeds the AS proposal, then to achieve an equilibrium state, it is necessary either with constant production volumes to raise prices or expand the production of products. If the AS proposal exceeds the demand of AD, then you should either reduce production, or lower prices.
Increasing the total demand in the classic (vertical) segment does not affect the volume of real production volume, since this segment implies full-time. IN this case Only raise prices.
As a result of the above, the question arises: how long can the equilibrium in the economy be preserved, if you submit that it is achieved? With a change in the phases of the economic cycle, market conditions, income in society occur in demand. All this indicates that an equilibrium condition cannot remain unchanged for a long time. Coordination of supply and demand, the relationship of the basic elements of the national economy can be achieved only in dynamic development, and the short-term (current) equilibrium is only its prerequisite.
Equilibrium in the economy is such a state of the system into which it is constantly returning in accordance with its own patterns. In the event of a violation of an equilibrium state, the general direction of the process becomes essential, i.e. It is important to know, increases or weakens macroeconomic non-equilibrium.
Another macroeconomic model reflecting the ratio of aggregate demand and the cumulative proposal is the Keynesian model "Revenues - expenses". For several decades of the XX century. The macroeconomic policy of the leading states of the world lay the theory of J. M. Keynes, according to which the main reason economic crises lies in the insufficiency of aggregate demand. The insufficiency of aggregate demand caused two main reasons:
1) the action of the main psychological law, according to which, as the income grow, people increase the one share that goes on savings. To describe this pattern, indicators of inclination for consumption and savings are used:
Limit tendency to consumption (MRC \u003d ΔC: ΔU) Shows the change in the value of consumption depending on the change in income,
Limit tendency to savings (MPS \u003d ΔS: ΔY) determines the change in the amount of savings depending on the change in income;
2) a low rate of profit on capital due to a high level of interest (this reduces investment demand from firms).
Under these conditions, the objective of the state is to compensate with public spending Falling aggregate demand.
IN keynesian model "Revenues - expenses" the equilibrium of the market is achieved when the total costs of AE are equal to the total income Ni (national income), and Ni \u003d di (disposed of income).
Ni \u003d d Denote by y. The flow of expenses is the total demand, and the revenue flow is a total proposal. To build a model, you must write down the following equalities: ae \u003d y, ad \u003d ae, as \u003d y,
From g and nx (demand from the state and foreign market) we abstract.
Hence,
We build a coordinate system (Fig. 4.4).

Fig. 4.4. Equilibrium model "Revenues - expenses"
To determine the equilibrium point, it is necessary to carry out a line at an angle of 45 °. All points of this straight are in equilibrium - expenses are equal to income. To find the equilibrium point you need, you need to build a consumption line:

We construct a line C. We take Y for zero. Then C will be equal to exogenous (100). Press Y, for example, a value of 200 units. Then C \u003d 100+ (0.8x200) \u003d 260.
The intersection point of direct consumption with a line at an angle of 45 ° is called a critical point in which all income is consumed. With the values \u200b\u200bof consumption above this point, part of the income goes on savings. If consumption exceeds the disposable income (the area located on the left of the critical point), then it is carried out in part due to the previous savings.
Now it is necessary to build a line of savings and find a point where investments are equal to savings. We build a line of savings S \u003d SEX + MPS x Y. When y \u003d 0, this line will pass through the point (-c), since all savings will go to consumption. Where the critical point is designed to the axis OH, S \u003d 0.
Now you need to find the point of intersection of the savings line with the line of investment. Investment demand is quite changeable. Its size is determined by the expected net profit, the real rate of interest, production technology, tax level and other factors. In our example, we make the assumption that investment demand is 50 units. At all levels of income. Sprogating the point of intersection of the line S and line I on the line at an angle of 45 °, we will find a point of equilibrium. Direct AE \u003d C + I will also pass through this point (parallel line C).
The determination of the point of general equilibrium is necessary to predict the development of the economy. If in this moment The actual national income is less equilibrium, one can assume that the economy will expand. If the size of the national income exceeds the equilibrium level, it can be assumed that there will be a reduction in production. There is a question for which magnitude will the national income change due to changes in costs?
The cost multiplier is a numerical coefficient showing how many times the final amount of increment or reduction of the planned costs that form a national income will exceed the initial amount of expenses.
Simple multiplier formula:
Consider the multiplication process on a simple example. Suppose the investment in society increased by 1000 units. On the one hand, it is expenses, on the other - income. These cash are materialized in the form work force, equipment, raw materials and other goods. The owners of these production factors will receive income, also equal to 1000 units. At MRC \u003d 0.8, they will guide the consumption of 800 units., And on savings - 200 units; 800 units. Also for someone will become expenses, and for some kind of income (Table 4.1).

As a result, the initial investment in 1000 units led to an increase in national income to 5000 thousand units (with a multiplier, equal to 1: 0.2 \u003d 5), i.e. 1000 x 5 \u003d 5000.
The method of acceleration is closely connected with the multiplication process. Its essence lies in the fact that the growth of income as a result of the multiplicative effect of the initial investment causes an increase in demand for consumer goods, which in turn causes an increase in demand for the means of production, and to a much greater extent. This is due to the fact that the equipment of enterprises (fixed capital) is expensive and requires significant capital expenditures.
The measure of the acceleration scale is an accelerator - a numerical factor to which each monetary unit Increased income increases investment. It is calculated by the formula:
It should be noted that the principles of animation and acceleration have bilateral effects. The increase in savings in terms of incomplete employment and insufficient demand generates "Paradox of Leather" - reduced savings and investments in society as a whole. Even a small reduction in investment gives a reverse multiplicating effect - a multiple reduction in national income. The accelerator action can also generate not only an increase in investment costs, but also lead to a drop in demand for fixed assets, subject to a decrease in the growth rate of demand for consumer goods.
Researchers explain the processes of expansion and reduction business activity The combination of the action of the multiplier and the accelerator and believe that it is possible to find such a combination of these coefficients, which will ensure an unlucky growth of the economy.
(Materials are presented on the basis of: E.A. Maryganova, S.A. Shapiro. Macroeconomics. Express course: tutorial. - M.: Knorus, 2010. ISBN 978-5-406-00716-7)
Course work
Models of macroeconomic equilibrium of aggregate demand and cumulative supply
Introduction
Chapter 1. The concept and factors of aggregate demand and the cumulative supply
1.1 The concept of aggregate demand and its components, factors change in demand
1.2 Concept of Cumulative Offer, Change Factors
Chapter 2. Macroeconomic Equilibrium: Basic Models
2.1 Classical macroeconomic equilibrium theory
2.2 Macroeconomic equilibrium in the AD-AS model
2.3 Keynesian model of general equilibrium
Conclusion
List of used literature
Introduction
Achieving macroeconomic equilibrium as simultaneous equilibrium in all markets, i.e. as equilibrium economic System In general, a practically difficult task is almost difficult. Its solution is particularly complicated in a predominantly intensive type of economic growth, for which significant quantitative and qualitative changes are characterized in all socio-economic relations.
However, the achievement of macroeconomic equilibrium is so important for the effective development of the socio-economic system, that this problem can not be out economic theory and practices. After all, the achievement of macroeconomic equilibrium would mean proportionality in production and consumption, offering and demand, production costs and results, material and material and cash flows. This would ultimately be implemented by the implementation of the economic interests of each of the subjects at the macrosystem during their mutual consistency.
In other words, macroeconomic equilibrium is the optimal ratio in the entire system of socio-economic quantitative and qualitative relationships in national Economics. This optimum serves as a generalizing indicator of the economically and socially efficient functioning of the system at the country level. However, attempts to achieve Optimum are the desire to achieve the perfect state in the socio-economic development of the system, which is practically impossible.
At the same time, even by the impossibility of a practical solution to the problem of macroeconomic equilibrium, not only in a market, but also a directive planning system, economic science is making increasingly successful attempts to objectively understand the functional socio-economic relationships on the macro level in the conditions of market relations. These studies are not only informative, but also applied: objectively understand, moderately quantitatively estimate proportional relationships in order to increase efficiency state regulation and extremely reduced socio-economic losses from macroeconomic disproportionality.
The purpose of our work is the analysis of the models of economic equilibrium demand and suggestions that were developed by various researchers.
To implement the goal, it is necessary to solve the following tasks:
consider the concept of aggregate demand and its component elements;
consider non-price factors affecting the amount of demand;
consider the concept of aggregate supply and factors affecting it;
to define macroeconomic equilibrium;
consider macroeconomic equilibrium on the example of a classic model, the AD-AS model and the Keynesian model.
Chapter 1. The concept and factors of aggregate demand and the cumulative supply
1.1 The concept of aggregate demand and its components, factors change in demand
Cumulative demand, aggregated demand is a cumulative volume economic Goods (goods and services) who are willing to buy households, business and state at various price levels. In accordance with this definition, the curve of aggregate demand can be represented as in Figure 1.
Fig.1 Curve Cumulative Demand
In economic theory, under the cumulative demand is also understood by all macroeconomic subjects Cumulative expenses for the purchase of all finite goods and services created in the national economy.
In accordance with the distribution of expenses between individual sectors of the economy, the following main elements singled out:
consumer spending of the population (c);
investment spending of the private sector (I);
state procurements (G);
pure exports (NX).
As a result, the cumulative demand as a whole can be represented as the sum of the specified cost elements:
Y d \u003d c + i + g + nx (1)
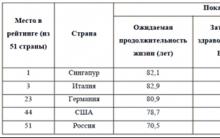
Most of the total demand is the expenses of the population on goods and consumer services, i.e. Element C, for brevity frequently called consumption. The share of these expenses in the country's national income reaches approximately 50% in Russia, and in the USA - about 67%. Even more high, the proportion of the element with in the total volume of the population's costs in the market is. The only component of these expenses not included in the consumption costs are the cost of building housing.
Under investment expenses (investments) means the demand of households on investment goods. Firms buy these products to increase the reserve of real capital and restore worn capital. Households buy new homes and apartments, which is also part of the investment. The total investment is about 15-20% of the country's GNP.
In macroeconomics, investment is meant only to buy new real capital. The total investment costs of the private sector of the economy (gross private investment) include:
renovation investments that replace the current capital as its disposal;
pure private investments intended to increase the real stock of capital in the national economy (main production Funds and commodity reserves of enterprises, as well as residential foundation in the property of households).
These types of investments have not only different targets, but also different sources of financing. The source of renovation investments are depreciation deductions firms that characterize the amount of capital consumed in the production process in this year. The main source of financing net investments in a market economy is the savings of households, and additional savings of firms (retained corporate profits).
If in some period the total investment exceeds the amortization deductions, then net investments are positive. In this case, the country's production facilities grow and the economy is on the rise.
Third Element of Cumulative Demand - Government Procurement of Goods and Services . These are expenses government agencies the authorities of all levels for the purchase of goods and services of labor employed in public sector. It does not include state transfer payments to the population, as well as subsidies and subventions of firms. Such expenses are not the cost of acquiring finite goods and services, but only reflect the process of redistributing a part of the state's income to households or firms. The share of public procurement in the total volume of expenses for the purchase of goods and services depends on the degree of participation of the state in the redistribution of the country's national income, the level of tax rates and the size of the deficit state budget. In Russia, its value is about 30% of the country's national income.
Pure export (NX.) it is the difference between export and import.
The structure of demand for 2006 expenses is presented in Table 1.
Table 1
The structure of the aggregate demand of Russia based on expenses for 2006
In modern economic theory, theoretical substantiation of the descending dependence of the planned amount of purchases from the price level given by representatives of neoquinsianship and neoclassical synthesis. This rationale is based on the characteristics of three effects in the economy caused by a change in the overall price level.
Effect interest rate. The essence of this effect is that with raising the price level, the demand for money increases, and this is with a constant volume. cash In circulation, it necessars the increase in interest rate. Interest rate growth, in turn, reduces incentives for investment and consumer spending. At high interest rates, businessmen cease to consider the devotable investment projectsAnd many consumers lose interest (or ability) in obtaining loans.
Effect of wealthit is that increasing price level reduces the real value of many financial assetsbringing fixed income to their owners ( bank deposits and bonds). I feel poorer because of the impairment of savings, consumers begin to save on purchases, seeking to restore the former level of wealth.
Effect of imported procurementdue to the influence of price level changes in a particular country on the ratio of domestic and world prices and the competitiveness of domestic and foreign goods. Increasing the overall level of prices in one country will contribute to the import of more goods into this country, since the prices of foreign goods will become more attractive and their competitiveness on the world commodity market will rise. At the same time, the rise in prices in any one country will force foreign consumers to refrain from buying goods of a given country that have become less competitive.
I. Economy
27. Macroeconomic equilibrium. Cumulative demand and cumulative offer
Before proceeding to the consideration of the model of macroeconomic equilibrium AD - A.S., we formulate the concepts of aggregate demand and the cumulative supply, taking into account the factors that determine them.
Cumulative demandshows the real amount of national production, which consumers, enterprises and government are ready to buy at any possible price level. The curve of aggregate demand indicates the reverse, or negative, dependence between the price level and the real volume of national production (Fig. 27.1).
The nature of the curve of aggregate demand (AD)determined by three factors: the interest rate effect; the effect of wealth, or real cash balances; Effect of import procurement.
Interest rate effect It shows that the interest rates increase with increasing price levels, and the increased interest rates lead to a reduction in consumer spending and investment. This, in turn, causes a reduction in demand for the real amount of national product.
Effect of wealth, or real cash balances It is expressed in the fact that at a higher price level, the real cost or purchasing power of material values \u200b\u200b(money on urgent accounts, bonds with fixed cash cost) It decreases and, therefore, the population is poor and will reduce its costs. And, on the contrary, with a decrease in the price level, the real cost of material values \u200b\u200bincreases and expenses will increase.
Effect of imported procurement It assumes that with raising prices in comparison with the prices abroad, the effect of import procurement leads to a decrease in total demand for domestic goods (services). Conversely, a decrease in price level contributes to the reduction of imports and thereby increasing net exports in total demand.
Changes in total demand caused by change in the price level, from those caused by changes in the non-price factors of total demand should be distinguished. The latter includes changes in consumer, investment, state expenses, net exports.
Cumulative offer Reflects the dimensions of the created national product and generated reproduction of reproduction prices. Form of the curve of the cumulative supply ( As) At the same time, it captures the change in the level of specific costs in the production of a particular value of the GNP, depends on the priorities and "crisis points" of economic growth, from the level of production, below which the rapid decomposition of the economic system comes. Curve BUTS. Shows the real amount of national production, which will be produced at different price levels. It consists of three segments: 1) horizontal (or Keynesian)when the national product varies, and the price level remains constant; 2) vertical (or classic)when the national product remains constant at the level of "full employment", and the price level may vary; 3) intermediateWhen the real amount of national production is changed, and the price level.
Fig. 27.1. Curve Cumulative Demand (AD) and Cumulative Offer (AS)
The curve of the cumulative proposal may undergo shifts towards increasing or reduced under the influence of changes in non-price factors (prices for domestic and import resources, labor productivity, legal norms, state regulation methods).
The volume of the real national product (the cost of the product is in constant prices) and the rate of inflation that ensure equality between cumulative demand and proposal is commonly called "The state of general macroeconomic equilibrium" Economy. Crossing curves BUTD. and BUTS. Defines macroeconomic equilibrium: the equilibrium level of prices is established and the equilibrium amount of national production.
The consequences of an increase in total demand depend on how the segment of the aggregate supply curve is occurring. Increase in aggregate demand on Keynesian segment leads to an increase in the real volume of the national product, but does not affect the price level, because The economy, leaving the crisis, uses available capacity (Fig.27.2, a). Increase in aggregate demand on the intermediate cut It leads to an increase of both the real volume of GNP and the price level (Fig. 27.2, b), as the economy is approaching the state of complete employment (Q Fe). On the classic cut An increase in total demand leads to an increase in price levels, and the real volume of GNP cannot go beyond its level "with complete employment" - resources are exhausted (Fig.27.2, B).

Cumulative demand is a model graphically represented in the form of a curve showing various volumes of goods and services, i.e. The real amount of national product, which separate consumers, enterprises and the state are ready to purchase in these prices
Cumulative demand (AD) is just a synonym for the expression "cumulative expenses". It consists of the same components: consumption (C), investment (IQ), government spending (G) and pure exports (HP).
The descending trajectory of the aggregate demand curve (AD) indicates that the lower the price level, the greater the real volume of the GNP, which can be purchased.
Despite the similarity of the curves of individual and aggregate demand, they differ in content, and depending on the price level. The amount of aggregate demand is influenced by many factors that are divided into price and non-counseled. The price includes the effects of interest rates, real cash balances (wealth), import procurement. They determine the character of the AD curve.
The interest rate effect assumes that the trajectory of the aggregate demand curve is determined by the impact of the changing level of prices at the interest rate, therefore, on consumer spending and investment. When the price level rises, interest rates increase, and their increase, in turn, leads to a reduction in consumer spending and investment.
The impact of the effect of wealth is manifested in the fact that with a higher price level, the purchasing power of accumulated financial assets in the population decreases.
With raising prices, the effect of import procurement leads to a decrease in total demand for domestic goods.
The considered effects make it possible to predict changes in national production volumes due to a change in total demand (other things being equal).
If the conditions change, it is necessary to take into account the non-citizens of aggregate demand. They determine the position of the AD curve, their action shifts this curve (at a fixed price level). Intense factors include consumer spending (c); Investment costs (IQ); government procurement of goods and services (G); Pure exports (HP).
Increasing costs shifts the curve to the right, the decrease leads to its removal to the left.
The total proposal shows the real volume of output, which entrepreneurs will produce and sell at different levels of prices (AS).
A graphically aggregate sentence is represented in Fig. 11.5 in the form of a curve showing the relationship between the price level and the level of the real volume of national production (with other things being equal). Higher prices stimulate the production of an additional amount of goods and their offer in the market. On the contrary, more low prices cause a reduction in production. Therefore, the curve of the aggregate offer expresses direct relationship between the level of prices and the volume of the national product.

Keynesian I. neoclassical schools Differently interpret the configuration of the cumulative supply curve. On the scale of the entire economy there may be three different situations Horizontal cut (Keynesian). At this gap, the real volume of production has not yet achieved its potential level, there are capacity reserves, raw materials, the level of employment is incomplete. The horizontal segment indicates that the economy is in depression. On this segment, production growth will occur due to unused resources and will not be accompanied by rising prices. The unemployed, who dreamed, agrees to the existing wages, and the owner of the commodity reserves agree to sell them at existing prices. On a horizontal segment, production growth and employment will occur without inflation;
intermediate segment.There is also an increase in production, and price increases. The economy begins to approach its potentially possible level, but complete employment occurs unevenly. A less qualified workers are taken to work, and the raw materials are bought at higher prices;
vertical segment (classic).On this segment, production has reached its potential level when all resources are involved and fulfilled complete. In a short time it is impossible to achieve further increase in production.
Changes in non-price factors - a change in prices for resources, a change in performance, a change in legal norms - lead to the shifts of the aggregate supply curve.
Independent factors have one common hell: When they change, the costs per unit of products are changed.
From the point of view of the national economy (macroeconomic analysis), the intersection of cumulative demand (AD) curves (AD) and the aggregate supply (AS) determines the equilibrium level of prices and the equilibrium real amount of national production. Equilibrium on the commodity market occurs when AD \u003d AS (Fig.11.6).

The plans of buyers and sellers (manufacturers) completely coincide at point A. When such a correspondence is achieved, the circular flow as a whole is in equilibrium in the same way as a separate market is in a state of equilibrium, if the plans of buyers and sellers on it coincide.
In real life, the plans of consumers and manufacturers almost never exactly coincide, as they are far from always advocate to each other before the start of production. Each company builds its production plans Based on the information that is available to it. Consumers build their plans, focusing on market prices And expectations regarding their changes in the future. Since production plans are often defined before consumers formulate their plans, there is no confidence that these two groups of plans will be fully compatible.
Suppose that due to the influence of any non-price factor, an AD1 in AD2 occurred. In this case, entrepreneurs discover that the needs of the population in products are superior to production capacity. What will make manufacturers in such a situation? Two solutions are possible: without changing the volume of production y1, raise prices or expand the production of products. In normal market economy They will not go to a sharp price increase for more benefits, but will try to increase production to expand the market for their goods and thus achieve profit growth. But the increase in production leads, as a rule, to an increase in production costs (due to a limited proposal of resources) and to the increase in price level. In other words, the new equilibrium point in corresponds to higher values \u200b\u200bof production (y2) and price levels (P2).
Thus, the growth of aggregate demand AD with unchanged AS should lead to an increase in the national product and price increases. Which will prevail-expand the volume of production or price increase - depends on how close the country's economy is suitable for the level of complete employment: when moving from point A, the production growth will prevail, and the further shift of the AD curve to the right and up will result in Relative price increases (point C).
The fall in total demand means that goods are produced more than there are potential buyers (in Fig. 11.6, this corresponds to an inverse movement from AD2 in AD1). And again, manufacturers can have two options out of this situation: either cut production, or leave the release unchanged, but lower prices. The decline in prices, of course, helps reduce stocks in warehouses, but at the same time leads to a decrease in profits and losses. That is why the first reaction of producers to reduce the aggregate demand is to reduce production and attempt to sell products from warehouses at competitive prices. If this does not lead to success, then manufacturers are forced to reduce goods prices.
Reduced aggregate demand leads to changes to Y and P - both are falling. Reducing the price level will prevail until the dismissal of workers begin. In any case, the drop in production volume (y) and a decrease in price level (P) leads to lower values \u200b\u200bof GNP and ND.
Let us now consider the reaction of the economy to change the aggregate offer. Let AS have increased. This means that manufacturers offer products more than them can buy consumers at existing prices. As a result, the price level falls, and the sales and production of goods grows, the AS1 curve shifts to the right to AS2, the new equilibrium point D corresponds to a higher value to and smaller than the value of R. Since the changes y and p occur in various directions, An unambiguous conclusion that ND will increase or decrease, it is impossible.
The price level and the level of the real national product at the moment are determined by the intersection of AD and AS curves. The intersection of these curves is called macroeconomic equilibrium.
To achieve and maintain it:
the active role of the state, since the market mechanism does not provide sustainable compliance between investment demand and capital supply;
a developed savings accumulation system that absorbs cash surplus available to potential investors, and easily turning into investments;
state policy impeding inflation.
Today, when the global economic catastrophe unfolds, naturally nostalgia for another state, which is characterized by stability. In economic theory, such a state was called macroeconomic equilibrium. In this topic, it is precisely considered that such a macroeconomic equilibrium and what is the mechanism of its achievement. And first of all, turn to the definition of the specified concept.
Macroeconomic equilibrium is such a state of the national economy when the use of limited economic Resources To create goods and services and their distribution between different members of society, balanced, i.e. There is a cumulative proportionality between resources and their use; production factors and the results of their use; production and consumption; proposal and demand; material and real and financial flows.
When developing models of macroeconomic equilibrium, significant development has been obtained, analyzing the conditions for ensuring equality between the total demand and the cumulative proposal in the national economy.
Cumulative demand is the sum of all individual demands on the final goods and services offered in the commodity market. It consists of consumer spending (aggregate household demand), investment costs of enterprises, government spending and costs for clean exports.
The curve of aggregate demand (DD) shows the number of goods and services that consumers are ready to purchase at the corresponding price level (Fig. 16). It gives such options for combining the volume of production of goods and services and the overall level of prices in the economy, in which commodity and money markets are in equilibrium.
In macroeconomics, two main factor affect the level of aggregate demand: the amount of money in the economy (M) and the speed of their turnover (V).
The negative slope of the cumulative demand curve can be explained as follows: the higher the price level (P), the less real reserves money, (M / p), and therefore, the less and the number of goods and services to which the demand is presented (q). The dependence between the value of the total demand and price level is also associated with the effect of interest rate, the effect of wealth and the effect of import procurement. So, with rising prices, the demand for money and interest rate increase. The increase in the cost of the loan leads to a decrease in consumer and investment costs and, accordingly, to a decrease in the volume of aggregate demand. The rise in prices also reduces the real purchasing power of accumulated financial assets with fixed value (bonds, urgent accounts) and encourages their owners to reduce costs. Rising prices within the country at unchanged import prices move part of demand from the internal goods to import and reduces exports, which also leads to a fall in total demand in the economy.
As the population income is heard, which are a factor of aggregate demand, conservation appear and grow. Savings can be represented as a difference between income and consumption (consumer spending). In economic theory for analyzing the role of consumption and savings in ensuring macroeconomic equilibrium, the concepts of "consumption function" and "Saving function" were introduced.
The consumption function shows the ratio of consumer spending on income in their dynamics. Similarly, the function of saving, which shows the ratio of family savings to its income in their dynamics.
The trend in changing the magnitude of the consumption of the population as income growing is characterized by a utmost leaning to consumption: it shows which part additional income It goes on consumption increment. By analogy, the limit propensity to the savings shows which part of the additional income by the population is used for additional savings when the income value changes.
According to Keynes, the psychological tendency of a person to save a certain part of the income is constrained by an increase in income due to the reduction in the amount of investment, on which permanent revenue detection depends. In turn, the limiting tendency of a person to consume is constant and therefore may determine the sustainable relationship between an increase in investment and income levels.
Obviously, the main factor affecting the levels of consumption and savings is income. In addition, taxes, prices for goods and services, sales in the market are affected for consumption and savings.
The total proposal is the sum of all individual proposals and represents the monetary value of the total amount of all finite goods and services for sale (Fig. 17). It consists of wages, rent, percentage and arrived.
The curve of the aggregate offer shows how the amount of total release can be offered to the market by manufacturers with certain values \u200b\u200bof the total price level in the economy. The form of the cumulative proposal curve is interpreted in different ways: classical and Keynesian schools. Cut I describes the proposal in terms of incomplete employment, segment III determines the total proposal in the state of complete employment, and the segment II is characteristic of the proposal in the conditions approaching complete employment.
The same factors (technical and technological basis of production, production costs) that cause a change in the market of separate goods are affected to the aggregate proposal.
The classical theory of macroeconomic equilibrium that dominated economic science The beginning of the XX century (D. Ricardo, J. Mill, A. Marshall), is based on the situation that the level of cost is always sufficient to buy products created with complete employment. This class of classics is based on, so-called the law of SEA, according to which the process of producing goods itself creates income, exactly equal value of goods produced, i.e. The proposal generates its own demand (the amount of the sentence \u003d the amount of demand).
On this basis, it may be assumed that with this approach, the situation is not taken into account when part of the income can be saved, therefore this part will not find reflections in demand, the consequence of which will be the incident, reduction of production, unemployment and revenue decline.
Consequently, savings complicate the problem of achieving macroeconomic equilibrium. However, classic economists believed that savings do not lead to insufficient demand, since each savings will be invested. In addition, the firms sell a part of their products to each other (means of production) and this is complemented by a "space" in consumption (personal consumption plus a productive), due to savings. It was assumed that by fluctuating the interest rate, price elasticity and wages, the market makes in accordance with the costs and income, maintains the necessary amount of production and full employment in the economy. The graphic image of the classic equilibrium model is represented in Fig. eighteen.
Curve the cumulative offer vertical, it reflects only the volume of production. Cumulative demand is usually stable, but if it is reduced, the prices are reduced.
In the classical theory of macroeconomic equilibrium, the necessary volume of production and the natural unemployment rate is provided market mechanism. In these conditions, they considered classics, the most acceptable is economic policy State non-interference.
Price level (P) S Cumulative offer
Cumulative demand
Fig. 18. Graph of the classical theory of macroeconomic equilibrium
J. M. Keynes, having criticized the theory of classic economists, argued that the market economy is characterized by a non-equilibrium. It does not guarantee full employment of resources and therefore does not have the mechanism of automatic self-regulation. Criticia Keynes Classical equilibrium theory concerns two main points. The first one relates to the relationship of investment, savings and interest rates. So, between plans of investments and savings there is a nonconformity, since they are carried out by different economic agents, according to various reasons and are determined by various factors. Therefore, the interest rate is not the only motive that is taken into account when planning investments. According to the Keynesian model is not a percentage rate, and the magnitude of the disposable income of households is the main factor determining the dynamics of consumption and savings.
In addition, savings are not the only sources of investment. On the money market There is another source - credit institutionswho did not take into account the classics.
The second aspect of critics of classical economists concerns the mobility and flexibility of prices in a market economy. Appearance at the beginning of the XX century. The monopolist manufacturers and strong trade unions affecting market processes led to the fact that prices and wages ceased to be movable.
Thus, Keynes considered the cumulative demand is changeable, the prices are inelastic, so unemployment is preserved for a long period of time. From this it follows the need for macroeconomic policies of state regulation of aggregate demand.
The Keynesian model of macroeconomic equilibrium is presented in Fig. nineteen.
Curve Cumulative Offer - horizontal lineSince prices are inelastic. Cumulative demand is changed, the real volume of production is reduced.
Thus, on Keynes, the volume of production and, accordingly, the level of employment is directly dependent on the level of cumulative expenses (aggregate demand). The main component of cumulative expenses is consumption. Income after paying taxes is equal to consumption plus savings. Therefore, the factors determining consumption affect the savings. The main and permanent factor determining the magnitude of consumption and savings is the disposable income.
Price levels (P)
Cumulative offer
D Cumulative demand
0 Real production volume (q)
Fig. 19. Chart of Keynesian theory of macroeconomic equilibrium
The second component of cumulative expenses form investments. The amount of investment is determined by two main constant factors: the expected net profit rate and the real interest rate.
Since the cost of consumption and investment is determined by a number of other factors, the value of the total demand is generally characterized by instability. The instability of the latter causes an imbalance in the national economy. To achieve macroeconomic equilibrium, the cumulative demand should be "efficient". "Effective demand", according to Keynes, consists of consumption and investment costs. Maintain the effective demand of Keynes offers using a multiplier. Multiplier (MR) - coefficient showing the connection between the increase
Investments (DI) and GNP (DGNP) growth (its value in turn depends on the limit propensity to savings):
Investment multiplier mechanism Next. Investments in any industry cause expansion of production and employment in this industry. As a result, demand is additionally expanding on consumption items, which in turn causes expansion of their production. The latter determines the additional demand for the means of production, etc. In addition to the primary effect, secondary, tertiary, etc. occurs. Employment in some areas gives rise to employment in others as a derivative.
With an increase in investment, GNP growth will occur in much greater than the initial additional investment. This multiple, increasing effect in the size of the GNP is called a multiplication effect.
To express an impact of an increase in income into an increase in investment, an accelerator is applied. Accelerator (AR) is a coefficient indicating the quantitative ratio of the increase in investment of this year to the growth of national income last year.
Where - Investments current year; - ND last year.
Investment growth causes an increase in the income level, which at the stage of use decays to consumed and saved parts; At the same time, that part of it is sent to consumption, serves as a source of income for their manufacturers. The resulting income, in turn, disintegrates on consumption and savings, etc. Ultimately, the initial increase in investment leads to a multiple increase in income.
The effect of the multiplier acts in the opposite direction. With a minor reduction in investment spending, a significant reduction in income may occur. Therefore, for the stable and balanced functioning of the economy, it is necessary to ensure a certain value of the animation coefficient, to create conditions for the uninterrupted implementation of the investment process. Thus, thanks to investments, an increase in the total demand, employment and general income occurs.
Consequently, Keynesian theory appeared theoretical Justification The need for state intervention in the economy.
13.3 The theory of macroeconomic equilibrium K. Marx.
The value form of the total social product includes: permanent capital, or the cost of consuming means of production (C); Variable capital, or wage fund (V) and the surplus value created during the year (M).
When constructing the reproduction schemes, K. Marx proceeded from the following abstractions: 1) All the economy is conducted by the capitalist method; 2) reproduction is carried out without foreign trade; 3) There are only metal money in circulation; 4) prices of goods coincide with their cost; 5) the organic structure of capital (C / V) is invariably; 6) all permanent capital is consumed entirely during the year; 7) The rate of surplus value is unchanged and is 100%.
In order for reproduction to be carried out continuously, the annual product I and II of the divisions must be implemented. One part of the annual product IC should be implemented within this unit and cost, and in kind. Another part of the annual product I (V + M) should be exchanged for consumption items that are made only in the second unit, since it is intended for personal consumption of workers and employers.
In the second division, part of the annual product equal to IIC cannot be implemented in the same unit, as it reimburses the consumed means of production. Therefore, this part exchanges the products I division. Another part of the annual product II of the division - II (V + M) is refundable from the products of the same unit. Thus, the main condition of equilibrium at simple reproduction:
Derived terms are:
I (C + V + M) \u003d IC + IIC;
Ii (C + V + M) \u003d I (V + M) + II (V + M).
These equalities mean that the products of the I division should be equal to the reimbursement fund of both divisions, and products II divisions are a pure product of society. With extended reproduction, part of the surplus value of both units accumulates and acts as capital that is used to purchase additional funds Production and additional labor force. Therefore, with advanced reproduction:
I (C + V + M)\u003e IC + IIC;
Ii (C + V + M)\u003e I (V + M) + II (V + M).
This means that the pure product I of the unit must be more funds for the reimbursement of production tools in the II unit for the cost of the accumulated means of the production necessary for the expansion of production in both divisions.
Since the value permanent costs It does not depend on the production volume, the configuration of the AFC curve is descended in nature, which indicates that with an increase in production, the amount of permanent costs falls on an ever-increasing number of products (Fig. 8).


Translations - Bank Avangard Login
Maternity Market: New Realies
Mobile application "My intersection application My intersection
Program for the accounting of workwear and planning needs
Online loan application in MFI leader leader loan personal