For the first time, the name Forex strategy Pobeda began to appear on the RuNet about 5-7 years ago. And during its existence, this strategy has undergone a lot of changes, additions and optimizations of trading rules. We offer the most popular option for implementing this trading system, in which Pobeda works most profitably. Traditionally, you can download a template and a set of indicators for a strategy right at the end of the description of this strategy.
How does the Victory strategy work?
The Victory strategy is a scalping multi-currency system that was originally created for trading on the Forex market. Subsequently, set it technical indicators was significantly expanded trading rules optimized, and now it can be used both on Forex and on CFDs and commodity assets. The main requirement of this system is to use volatile trading assets with a small spread in trading.
The goal of “Victory” is to determine the beginning of an intense movement, take a small profit - around 5 points and “jump out” of the market before the price of the asset turns back. In other words, the Victory strategy is pure scalping – the most profitable and popular type of trading in the Forex market.
As in other similar strategies, the “Victory” scalping strategy works on the M1/M5 time frames, thereby ensuring the speed of taking profit and the ability to quickly test the system on the real market.
The “Victory” scalping strategy works using a set of technical Forex indicators, is easy to understand, easy to test, and most importantly, its rules are almost 100% formalized, that is, they give unambiguous and clear signals for concluding transactions.
Another feature is that this scalping strategy works during the daytime – from 10:00 to 18:00 Moscow time, that is, at a time when there is a trend in the Forex market.
At the end of the article, you can download a set of scalping indicators and a template for this trading system. When you apply the Forex strategy template to the quote chart, your MT4 desktop will look something like this:
Appearance graphics configured for trading using the Victory strategyComponents of the Pobeda system
As mentioned above, the Pobeda scalping system works using a whole set of forex indicators that help determine the dynamics of changes in quotes:
TMA – dynamic price channel, which is the “heart” of this scalping strategy. It consists of two main lines that determine the width of the amplitude of price fluctuations and a middle line that runs through the center of the channel. The numbers located near the channel boundaries show the distance in points to the center line. This indicator is very important for determining the entry level into a trade. Take-profit size in this trading strategy is 5 points. Therefore, if the distance to the middle line is less than this value, entering the trade is considered inappropriate.
TMASize CTF– indicator of the width of the TMA channel. If the indicator value is less than 10 points, a scalping transaction is not opened due to low market volatility. Under TMASize CTF the name of the trading asset and the current quotes are written in large letters; when they increase or decrease, this indicator changes color.
Currency PowerMeter– a special indicator that works like a heat map of currencies. With its help, you can determine the most active and most passive asset price charts on several timeframes. This indicator allows you to predict the strength of price movements of any currency from MT4 and, by comparing them into a pair, determine the prospects for the movement of currency pairs. That is, if, according to Currency PowerMeter data, EUR currently has the greatest strength, and USD the least, then, accordingly, the EURUSD currency pair will actively grow.
SSRC MTF– a proprietary oscillator that allows you to determine the moment of reversals and continuation of price trends. This indicator indicates the most optimal moments to enter the market on its scale with arrows in the corresponding direction. At the same time, this indicator can analyze the market on several time frames at once, allowing you to more effectively determine when trends change.
HP DIFF– an indicator that signals the need to exit trading positions, that is, the occurrence on the quote chart of circumstances preceding a price reversal in the opposite direction.
MasterMoneyBot– an indicator that calculates a trading lot in accordance with the risk management system chosen by the trader.
Download trading strategy files

How to install indicators in the MetaTrader 4 trading terminal.
You can learn how to install a Forex trading expert in MT4 from
No delay filter suitable for all time frames, great for showing breakouts.
The distinctive feature of the Hodrick-Prescott filter is that it does not retain. It is calculated by minimizing the objective function
F = Sum((u[i] – X[i])^ 2, r = 0..n-1) + lambda * Sum((u[+ 1]+u[i-1]-2*u[ i])^2, r = 1..n-2)
where x – Prices, and – filter values. Below is an example of the filter behavior (see HP.mq4 file attached below)
If the Hodrick-Prescott filter sees the future, what future values does it not imply? In order to answer this question, we must find a digital low-pass filter with a frequency parameter similar to the Hodrick-Prescott single filter, but with calculated directly using the past values of the “dual filter” itself, i.e.
u[i] = Sum(a[K]*X[i-k],k = 0..nx-1) – FIR filter
u[i] = Sum(a[K]*X[i-k],k = 0..nx-1) + sum(b[K]*i[i-k],k = 1..ny) – IIR filter
It is better to choose a “dual filter” that has a frequency-independent delay Tdel (constant group delay). IIR filters are not suitable. For FIR filters, the condition for frequency independent delay is as follows:
a[i] = +/-[n-1-i], i = 0..nx-1
The simplest constant delay KI filter is a simple moving average (High School):
u[i] = Sum(x[i-k],k = 0..nx-1)/nx
If n is an odd number, Tdel = (n-1)/2. If we move the SMA filter value back a number of bars equal to Tdel, the SMA values are the same as that of the Hodrick-Prescott filter. Exact mathematics cannot be achieved due to significant differences in the frequency parameters of the two filters (see table below):

To achieve the closest match between filter values, I recommend their channel widths to be similar (eg -6dB). The channel width of the Hodrick-Prescott filter of -6dBA is calculated as follows:
toilet = 2 * arszsh(0.5/Lambda ^ 0.25).
The -6dB channel width for the SMA filter is calculated numerically using the following equation:
|H(weight)| = no(n*toilet / 2)/without(toilet / 2)/nx = 0.5
The table below compares the values of two filters that have a similar channel width: red - Hodrick-Prescott (FiltPer = 25), blue - High School (Period = 15, Shift = -7). Note that there is no SMA data for the last 7 bars as it needs to know future prices. Nasty, the Hodrick-Prescott filter (red) shows some values. If the shifted SMA repeats the Hodrick-Prescott filter value on the last 7 bars after future prices appear, then what could those values be?

forecasting algorithms:
The indicator distinguishes between two forecasting methods:
Method 1:
- Set the SMA length to 3 and move it past 1 bar. With this length, the shifted SMA does not exist only for the last bar (Bar = 0), since it needs the value of the next future price Close[-1].
- Calculate the Hodrick-Prescott filter value in the last HP bar and assume that the SMA with unknown Close[-1] gives the same value.
- Find Close[-1] = 3 * HP – Close – Close
- Increase the SMA length to 5. Repeat all calculations and find Close[-2] = 5 * HP – Close[-1] – Close – Close – Close. Continue while the indicated sum of prices of future FutBars is calculated.
method 2:
- Set SMA length to 2 * FutBars + 1 and move SMA past FutBars
- Calculate SMA Filer's channel width. Equal to one Hodrick-Prescott filter. Find lambda.
- Compute the Hodrick-Prescott filter value on the last FutBars and assume that the SMA behaves the same when new prices appear.
- Find Close[-1] = (2*FutBars + 1)*HP – sum(Close[i],g = 0..2 * FutBars-1), Close[-2] = (2*FutBars + 1 )*HP – sum(Close[i],в = -1..2 * FutBars-2), etc.
The indicator shows the following input:
method – forecasting method
loadable – number of the last bar to check the prediction at existing prices (loadable > sign equals 0)
PastBars – the number of previous bars the Hodrick-Prescott filter is calculated for (the larger, the better, or by at least PastBars>2*FutBars)
FutBars – number of predicted future values
The indicator of predicted values is highlighted in red. Method 1 is used in the example below:


The second method is more accurate, but often has large spikes in the first predicted price. The described prediction method can be improved by searching for a COGO filter with a frequency parameter closer to the Hodrick-Prescott filter. For example, you can try HANNING, Blackman, Kaiser, and other constant delay filters instead of SMA.
MT4 Indicators – Download Instructions
HP extrapolator is a Metatrader 4 (MT4) indicator and the essence of a forex indicator is to transform accumulated historical data. The HP extrapolator provides the ability to identify various features and patterns in price dynamics that are invisible to the naked eye.
Based on this information, traders can assume further movement prices and adjust your strategies accordingly.
How to install HP Extrapolator.mq4?
- Download HP Extrapolator.mq4
- Copy HP Extrapolator.mq4 to your Metatrader directory / experts / indicators /
- Start or restart your Metatrader Client
- Select the Chart and time frame where you want to test your indicator
- Searching for “Custom Indicators” in the navigator mostly remains in the Metatrader Client
- Right click on HP Extrapolator.mq4
- Attach to chart
- Change settings or click OK
- HP Extrapolator.mq4 indicator is available on your chart
How to remove HP Extrapolator.mq4 from your Metatrader 4 Chart?
- Select a scheme where there is an Indicator running in Metatrader Client
- Right click on the graph
- “List of indicators”
- Select indicator and delete

MT4 indicators Download below:
Servers HP, new generation Gen8, since its entry into the market, began to be equipped with new hard drives supporting the technology SmartDrive. The hard drive “sleds” have undergone changes, which makes it possible to install a larger number of drives in the same server form factor. Also, changes have affected the external display of hard drives and now it can display a much larger number of states compared to previous generations. Let's take a closer look at what indications are now present on hard drives...
Let's start with the fact that technology SmartDrive allows you to indicate activity states, errors, and also store information about all these states. Technology SmartDrive Authentication allows you to determine the “authenticity” of installed hard drives in the server, the so-called "genuine HP drives".
It is also worth noting that disks from previous generations of servers (G6, G7) are not suitable and cannot be installed in Gen8 servers!
The front part of the disks (sled) contains the following indication: blue, background lighting - to identify the disk in the array. Indicator with a disk image to display the status. The "do not disconnect" indicator shows that the drive is in at the moment is in operation (for example, the array is being rebuilt) and under no circumstances should it be disconnected or removed from the recycle bin, etc.
| № | Indication | Description |
| 1 | Blue, background lighting | This indication allows you to quickly determine the desired disk in the array. Enabled using the RAID controller configuration program. |
| 2 | "Circular" activity indicator | Rotation occurs clockwise when one or more commands are executed. Displays activity on the hard drive |
| 3 | Hard drive status indicator |
Off - Disk is not configured Green (solid) - Drive configured Green (flashing) - The process of creating/rebuilding the array is in progress Green/Orange (flashing) - Configured but in a proactive state, the drive may soon fail and must be replaced. |
| 4 | "Lever" | Used to remove the hard drive from the basket. You must press the "eject" button |
| 5 | White indicator - “do not turn off” | Do not unplug or remove the hard drive from the cage while this indicator is white because this will destroy the logical drives on the array. |
1. The disk is in an unconfigured state - there is no indication

2. Disk is active

3. Disk in identification state, for example by ACU

4. The disk is in bad condition and needs replacement

5. The disk is in a state of anticipatory failure - failure is possible soon, needs to be replaced

6. The disk is in the state of creating/rebuilding the array

Hard Drive Status Indicator Chart

| № | State | Meaning | Description |
| 1 | No indication | Not configured | The hard drive is not configured with a RAID controller |
| 2 | Green (steady lit) | Configured | The hard drive is used in one or more logical drives |
| 3 | Green (flashing) | Rebuilding process | The hard drive is in the process of array rebuilding, data migration, or capacity expansion |
| 4 | Green/Orange (flashing) | Configured, proactive failure | The hard drive is in use in one or more logical drives and is in a pre-failure state |
| 5 | Orange (flashing) | Preemptive failure | The hard drive is not configured and is in a pre-failure state |
| 6 | Orange (steady lit) | Crash | The hard drive is faulty and needs to be replaced |
Let's move directly to the description of our strategy. The Pobeda trading system is an indicator scalping strategy with trading on a minute time period and filtering transactions on the M5 time frame. You can choose any trading instruments, but it’s best to start with EURUSD; besides, the strategy template is customized specifically for this currency pair. We do not recommend that you use more than one for trading currency pair, because, like everything else, the Pobeda trading system requires calmness, nerves of steel and quick reaction from the trader when making decisions. If, while trading on daily charts, receiving losses does not pose a particular danger to your deposit (of course, if you follow the simplest rules) and does not exert psychological pressure on the trader, then scalping strategies have high risks. The number of trades can sometimes exceed up to 100 per day, and a small series of losing trades can lead to a complete loss of the deposit.
Usually in scalping, transactions are concluded with an increased lot, and the lot is set at the level of 10-20 points. It is enough to close 2-3 unprofitable trades, and you can lose control of yourself and make many mistakes that will lead to disappointing results. However, strict adherence to the rules of the trading system and self-discipline can give a significant increase in your income, which can sometimes reach up to 20% per day. This is why scalping strategies are so popular among novice traders - you can make many trades a day and quickly expand your deposit. This is exactly what the “Victory” Forex strategy is. If you follow all the rules of this trading system, you can significantly reduce the number of losing trades and increase the percentage of profitable trades. By the way, the “Victory” strategy received this name because it was developed by May 9 - Victory Day, as it turned out later, the name turned out to be completely justified.
See also which ones are the most reliable.
What has changed in the new version of the “Victory” strategy?
In general, the classic fundamentals of the “Victory” strategy remain the same. The same indicators are used, but instead of fixed stop losses and take profits, percentage protective orders are used. What does this give? For example, by setting a take profit of 5%, you will know for sure that when you close a trade with a profit, your balance will increase by 5%, and this is in one trade! The TMA channel width indicator is now at the bottom of the screen. In addition, a new advisor has appeared that makes trading more convenient and efficient.

Below is a video that shows how to install strategy files into the MT4 trading terminal.
If you are looking for profitable Forex scalping, the Victory strategy is best option for fast . However, it is more suitable for more experienced traders, as it requires increased attentiveness and self-discipline. Beginners can be advised to first hone their trading skills on . Profitable trading to you!
Download free strategy files
The distinctive quality of the Hodrick-Prescott filter is that it has no delay. It is calculated by minimizing the objective function
F = Sum((y[i] - x[i])^2,i=0..n-1) + lambda*Sum((y+y-2*y[i])^2,i=1 ..n-2)
where x are prices, y are filter values. Here is an example of the behavior of this filter (see attached file HP.mq4)
If the Hodrick-Prescott filter looks into the future, what future values does it assume? To answer this question, you need to find a digital low-pass filter whose frequency response is similar to that of the Hodrick-Prescott filter, but whose values are calculated directly using past price values and past values of the “twin filter” itself, i.e.
y[i] = Sum(a[k]*x,k=0..nx-1) - FIR filter
y[i] = Sum(a[k]*x,k=0..nx-1) + Sum(b[k]*y,k=1..ny) - IIR filter
It is preferable to choose a “twin filter” that would have a frequency-independent delay Tzad (constant group delay). IIR filters are not suitable in this case. For FIR filters, the condition for frequency independent delay is
a[i] = +/-a, i = 0..nx-1
The simplest FIR filter with a constant delay is the Simple Moving Average (SMA):
y[i] = Sum(x,k=0..nx-1)/nx
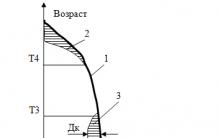
If nx is odd, the delay of such a filter is Tset = (nx-1)/2. If you shift the values of this SMA filter into the past by a number of bars equal to the Tback delay, then the SMA values will coincide with the values of the Hodrick-Prescott filter. An exact match cannot be achieved due to the significant difference in the frequency characteristics of the two filters illustrated in this graph

To achieve the closest match between the values of both filters, it is advisable to set their bandwidth (for example, at -6dB) the same. The -6dB bandwidth of the Hodrick-Prescott filter is calculated using the formula
wc = 2*arcsin(0.5/lambda^0.25).
The -6dB bandwidth for the SMA filter is found numerically from the equation
|H(w)| = sin(nx*wc/2)/sin(wc/2)/nx = 0.5
The graph below compares the values of two filters at the same bandwidth: red - Hodrick-Prescott filter (FiltPer = 25), blue - SMA (Period = 15, Shift = -7). Note that the SMA (blue) for the last 7 bars does not exist, because he needs to know future prices. The Hodrick-Prescott filter (red), on the other hand, shows some values. If we assume that when future prices appear, the shifted SMA will repeat the values of the Hodrick-Prescott filter on the last 7 bars, then what should these future values be?

Prediction algorithms:
The indicator has two built-in prediction methods:
Method 1:
1. Set the SMA length to 3 and shift the SMA to the past by 1 bar. With such a length, the shifted SMA does not exist only for the last bar (Bar = 0), because he needs the value of the next future price Close[-1].
3. We calculate the value of the Hodrick-Prescott filter on the last HP bar and assume that the SMA with the unknown Close[-1] gives the same value.
4. Find Close[-1] = 3*HP - Close - Close
5. Increase the SMA length to 5. Repeat all calculations and find Close[-2] = 5*HP - Close[-1] - Close - Close - Close. And so on until the specified number of future FutBars prices is calculated.
Method 2:
1. Set the SMA length equal to 2*FutBars+1 and shift the SMA to the past by FutBars
2. Calculate the SMA transmission frequency. We equate this frequency to the pass frequency of the Hodrick-Prescott filter. Finding lambda.
3. We calculate the values of the Hodrick-Prescott filter on the last FutBars bars and assume that the SMA will behave in the same way when new prices appear.
4. Find Close[-1] = (2*FutBars+1)*HP - Sum(Close[i],i=0..2*FutBars-1), Close[-2] = (2*FutBars+1 )*HP - Sum(Close[i],i=-1..2*FutBars-2), etc.
The indicator contains the following input data:
Method - prediction method
LastBar - number of the last bar to check the prediction at existing prices (LastBar >= 0)
PastBars - the number of past bars for which the Hodrick-Prescott filter will be calculated (the more the better, or at least PastBars>2*FutBars)
FutBars - number of predicted future values
The indicator plots the predicted values in red. The following example uses Method 1:

The second method tends to be more accurate in prediction, but often has large outliers to the first price predicted. The described prediction method can be improved by finding an FIR filter with a frequency response closer to that of the Hodrick-Prescott filter. For example, instead of SMA, you can try Hanning, Blackman, Kaiser and other constant delay filters.


Carrying out an inventory
Ulyukaev, Navka and Patrushev
Income tax refund for treatment: registration procedure and calculation of the deduction amount
Import substitution - what is it?
OSAGO minimum insurance period